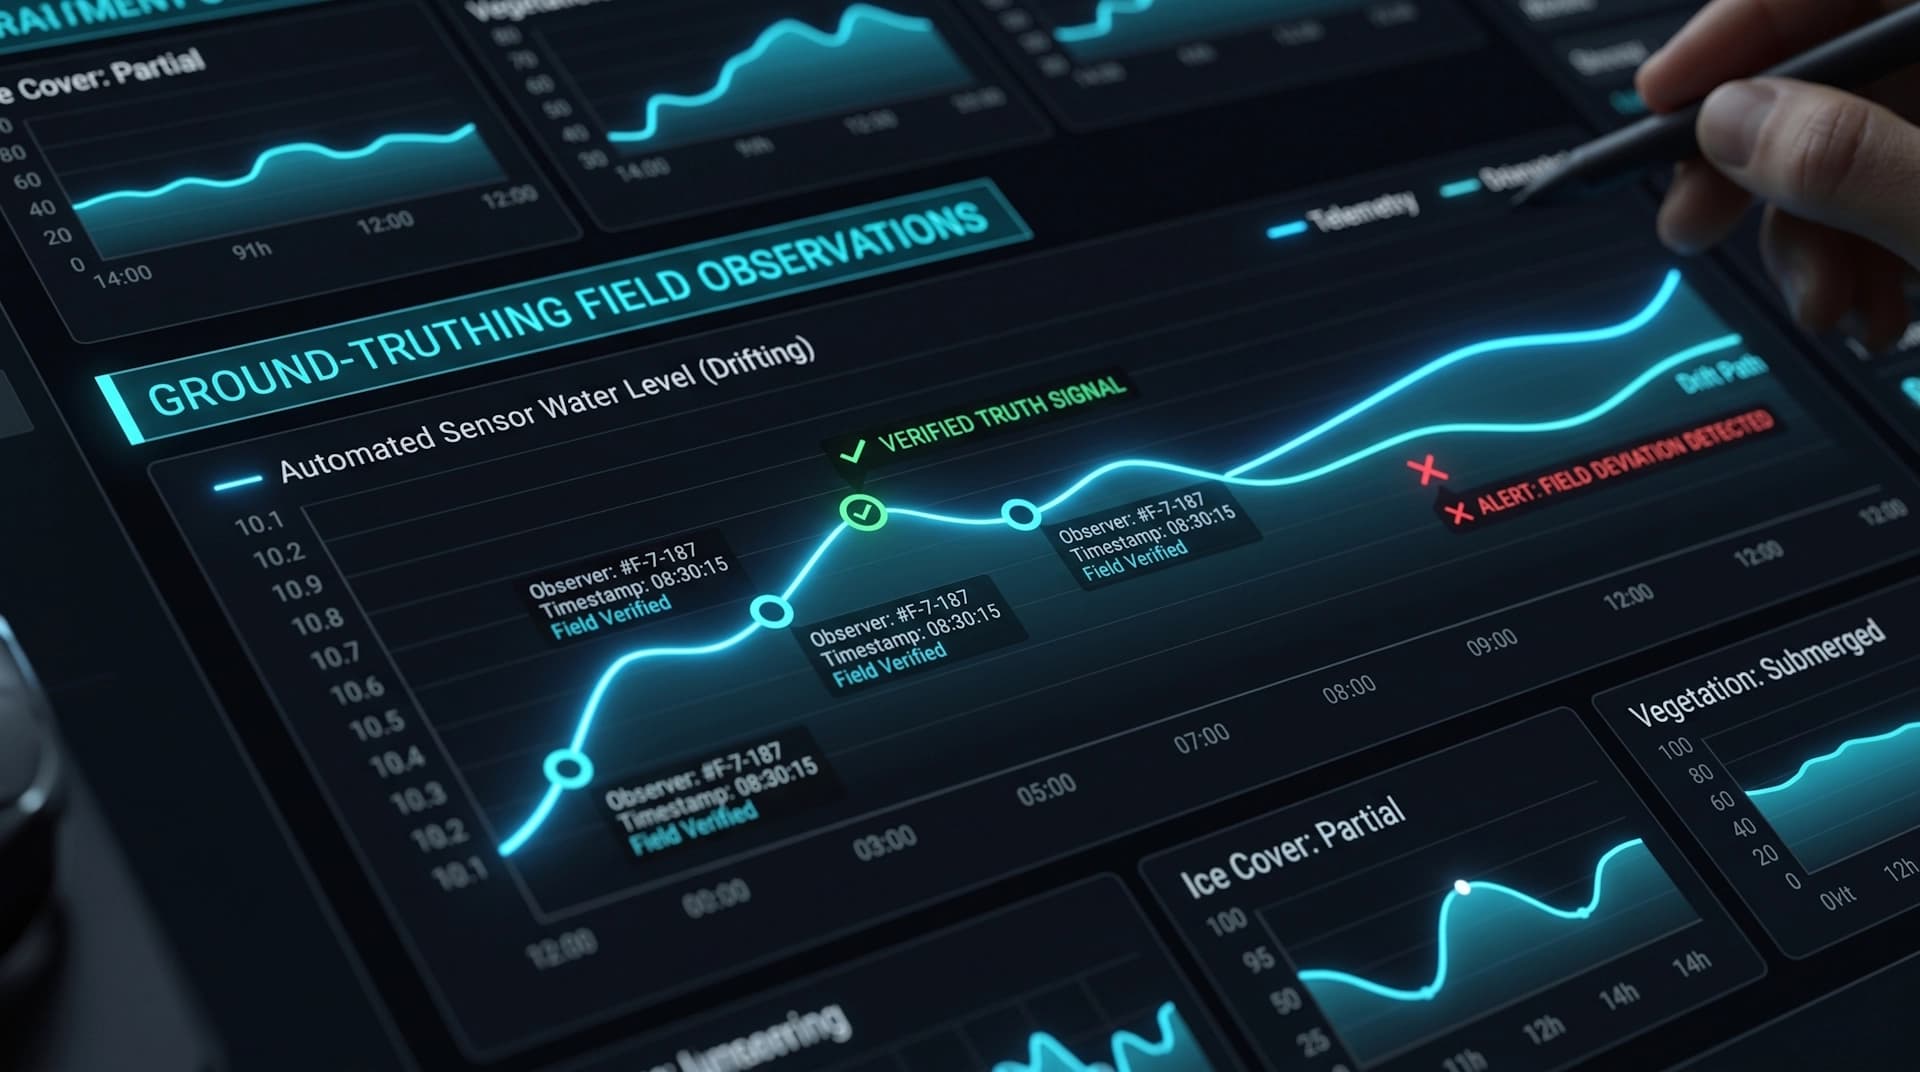

A water level climbing 20 cm in an hour is a number. The same reading next to a band of heavy rain sitting over the upper catchment is a decision. Station telemetry tells you what is happening at the gauge; it does not tell you what is coming, or what the terrain around the sensor looks like.
Users of monitoring platforms know this, which is why they keep a weather site open in another tab. The obvious fix - a commercial weather or satellite imagery API - comes with a subscription and per-request pricing that the platform carries for as long as it exists. That is exactly the kind of dependency I argue against in my piece on vendor lock-in.
For Wodowskaz I took a different route: an aerial orthophoto basemap and a live rain radar overlay, both built on official public data that is free to use commercially. The data itself is excellent; the work is in integrating it so it behaves like a native part of the platform.
Choosing Sources You Are Allowed to Build a Business On
"Free" on the internet usually means one of three things: free until you get traffic, free for non-commercial use, or genuinely open. Only the third is safe to build a client deliverable on, so the license was the first filter, not the last.
- Aerial imagery: GUGiK orthophoto. Poland's Head Office of Geodesy and Cartography publishes the national orthophoto through Geoportal. It is free for any use, including commercial, with attribution.
- Rain radar: EUMETNET OPERA. A pan-European composite built from the radars of national weather services, IMGW included. It is released under CC BY 4.0, so commercial use is allowed as long as the source is credited on the map.
Both licenses come with one hard requirement: visible attribution. That is not a footnote for the legal team - it is a UI element that has to be designed in from the start, next to the zoom controls, on every view where the layer is visible.
The Orthophoto: Simple, With Two Details Worth Knowing
Geoportal serves the orthophoto over WMTS in the same Web Mercator tile grid that OpenStreetMap uses. That makes the base layer itself almost anticlimactic - it is a regular tile layer with a different URL, and a map/orthophoto switch that remembers each user's choice.
ortho: {
  url:
    'https://mapy.geoportal.gov.pl/wss/service/PZGIK/ORTO/WMTS/StandardResolution' +
    '?SERVICE=WMTS&REQUEST=GetTile&VERSION=1.0.0&LAYER=ORTOFOTOMAPA&STYLE=default' +
    '&FORMAT=image/jpeg&TILEMATRIXSET=EPSG:3857&TILEMATRIX=EPSG:3857:{z}&TILEROW={y}&TILECOL={x}',
  attribution: 'Ortofotomapa © GUGiK',
  // The orthophoto covers Poland - no need to request tiles beyond it
  bounds: [[48.9, 13.9], [55.0, 24.3]],
}
The first detail is in that last line. The orthophoto covers Poland, so the map limits tile requests to the country's bounding box instead of asking for imagery that was never meant to exist beyond it. The second is setting the right expectations: the imagery is refreshed region by region on a multi-year cycle. It shows the riverbank, the bridge and the culvert next to a gauge - the terrain context around a station, not today's conditions on the river.
The Radar: Where the Actual Work Is
OPERA serves meteorologists and GIS systems across the continent, not one particular web map. It publishes composites for the whole of Europe as Cloud-Optimized GeoTIFFs in a Lambert Azimuthal Equal Area projection, kept in a public 24-hour buffer. My map speaks Web Mercator and only cares about Poland and the river basins that cross its borders. Everything between those two facts is a server-side pipeline that runs every 5 minutes:
- Read only what you need. A COG can be read with HTTP range requests, so the server downloads just the internal tiles over the area of interest - roughly 200 KB instead of a 3 MB file per frame.
- Reproject once, reuse forever. Mapping every output pixel from Web Mercator back to the OPERA grid is expensive, but it depends only on geometry. I compute that lookup table once and reuse it for every frame, so rendering a new frame is a simple array walk.
- Color it the way meteorologists do. Values are mapped to the familiar blue-green-yellow-red-purple reflectivity scale. Echoes below about 7 dBZ (roughly 0.1 mm/h) are dropped as noise rather than painted as drizzle.
- Ship plain images. Each frame becomes a transparent PNG on the server. The browser does no GIS work and never calls the radar provider - it just plays back the last two hours of images, with a second product for one-hour rainfall totals.
One detail matters more than it looks: "no rain" and "no data" are different things. Areas outside radar coverage are rendered as a faint grey haze, not left transparent. A transparent patch over a region with no radar would tell the user it is dry there - a quiet lie the map should never tell.
Resilience Is the Integration’s Job
Public data services are built for broad, open access, not for one platform’s uptime guarantees - a fair trade for data of this quality, and one that puts responsibility for resilience on the integration. Networks hiccup, frames are occasionally republished, and formats evolve over the years. So the pipeline treats interruptions as normal operation, not an exception:
- Each hour of the archive is listed independently, so a hiccup on an older hour never blocks the newest frame.
- Newest frames are rendered first. If a run hits its time budget, the map is still current - only the oldest animation frames wait for the next run.
- A frame that fails to process is retried after 10 and 30 minutes, then skipped, instead of being downloaded every 5 minutes forever.
- If OPERA republishes a frame - for example after late radars report in - the changed file version triggers a fresh render.
- Before rendering, the server checks the projection metadata of each file. If it ever changes unexpectedly, the map shows nothing rather than rain shifted 30 km to the side.
The outcome is a layer that degrades gracefully. If new frames are temporarily unavailable, the overlay simply stops updating; the station map, charts and alerts are untouched, because they never depended on it.
Being Honest About What Radar Can and Cannot Tell You
Radar does not measure rain. It measures how much of the beam is reflected back, and rainfall intensity is estimated from that with an empirical formula (I use Marshall-Palmer). The estimate is good for seeing where it rains and how hard; it is not a rain gauge. The legend reflects that: its labels are rounded to 0.4, 2, 7, 32 and 130 mm/h rather than pretending to a precision the method does not have.
Two more limits are worth stating up front to users: the radar runs about 5-10 minutes behind real time, and it shows rain that has already fallen, not a forecast. The stations on the same map remain the ground truth - which is why field-verified readings still matter even when a radar is painting the whole country.
Public geodata is one of the most underused assets in environmental monitoring. National orthophotos and pan-European radar composites are already paid for by taxpayers and licensed for commercial use - the investment is in the engineering that integrates them well, not in a monthly invoice. Build that once, and the platform gains context its users would otherwise look for in another tab, with no subscription to renew and no provider to be locked into. See the layers in context in the Wodowskaz case study, or explore my monitoring platforms and dashboards service.