Every article about IoT reliability assumes the same failure mode: the sensor goes silent, an alert fires, someone drives out to fix it. That is the easy case. The dangerous one is the sensor that keeps reporting - a plausible, in-range, perfectly formatted number - while quietly measuring the wrong thing.
A radar level sensor half-covered in ice. A staff gauge camera lens fogged by condensation. A pressure transducer drifting half a centimeter per month as its diaphragm ages. None of these trigger an error code. They just produce data that looks fine on a dashboard and is wrong in the field, and there is no way to tell the difference from the data stream alone.
The fix we shipped for this in Wodowskaz is not another sensor. It is a person with eyes, a five-field form, and a timestamp.
Why Sensors Lie Without Ever Failing
Automated anomaly detection is built to catch sensors that break loudly: a flatlined signal, a value outside physical bounds, a battery voltage that collapses to zero. It is very good at that job. It is structurally unable to catch a sensor that fails quietly - one that keeps producing numbers inside the expected range while the underlying measurement has drifted away from reality.
In hydrology specifically, this happens constantly: ice buildup biases a radar reading, riverbed sediment shifts under a fixed sensor mount, vegetation grows into the measurement path, or a calibration constant set at installation slowly stops matching the physical site. Every one of these produces a number that a threshold-based alert has no reason to flag.
The Cheapest Sensor You Already Have
Field staff already visit these stations for maintenance - battery swaps, cleaning, physical inspection. Historically, that visit produced nothing for the data platform: the engineer looked at the water, looked at the sensor, and left. We built the Observer flow, on web and mobile, to capture that look before it disappears.
It is deliberately not a free-text box. It mirrors the structure of a real hydrological field visit, because that structure is what makes the reading useful rather than anecdotal:
- Date and time of visit - anchors the observation to a specific point on the sensor timeline, not "sometime this week."
- Staff gauge reading - a manual water-level reading against a fixed physical marker, independent of any electronic sensor.
- Ice conditions - full cover, partial cover, drift ice, or none - because ice is one of the most common silent causes of radar and pressure sensor error.
- Vegetation and siltation - surface growth, submerged growth, emergent growth, or channel obstruction, all of which physically interfere with a fixed measurement point.
- Free-form notes - an escape hatch for anything the checklist does not anticipate, from visible damage to unusual debris.
Filling it out takes under a minute in the field. What comes back is not a vague "checked, looks fine" - it is a structured, timestamped, IMGW-style observation that a hydrologist can actually reason about.
Turning One Reading Into a Trust Signal
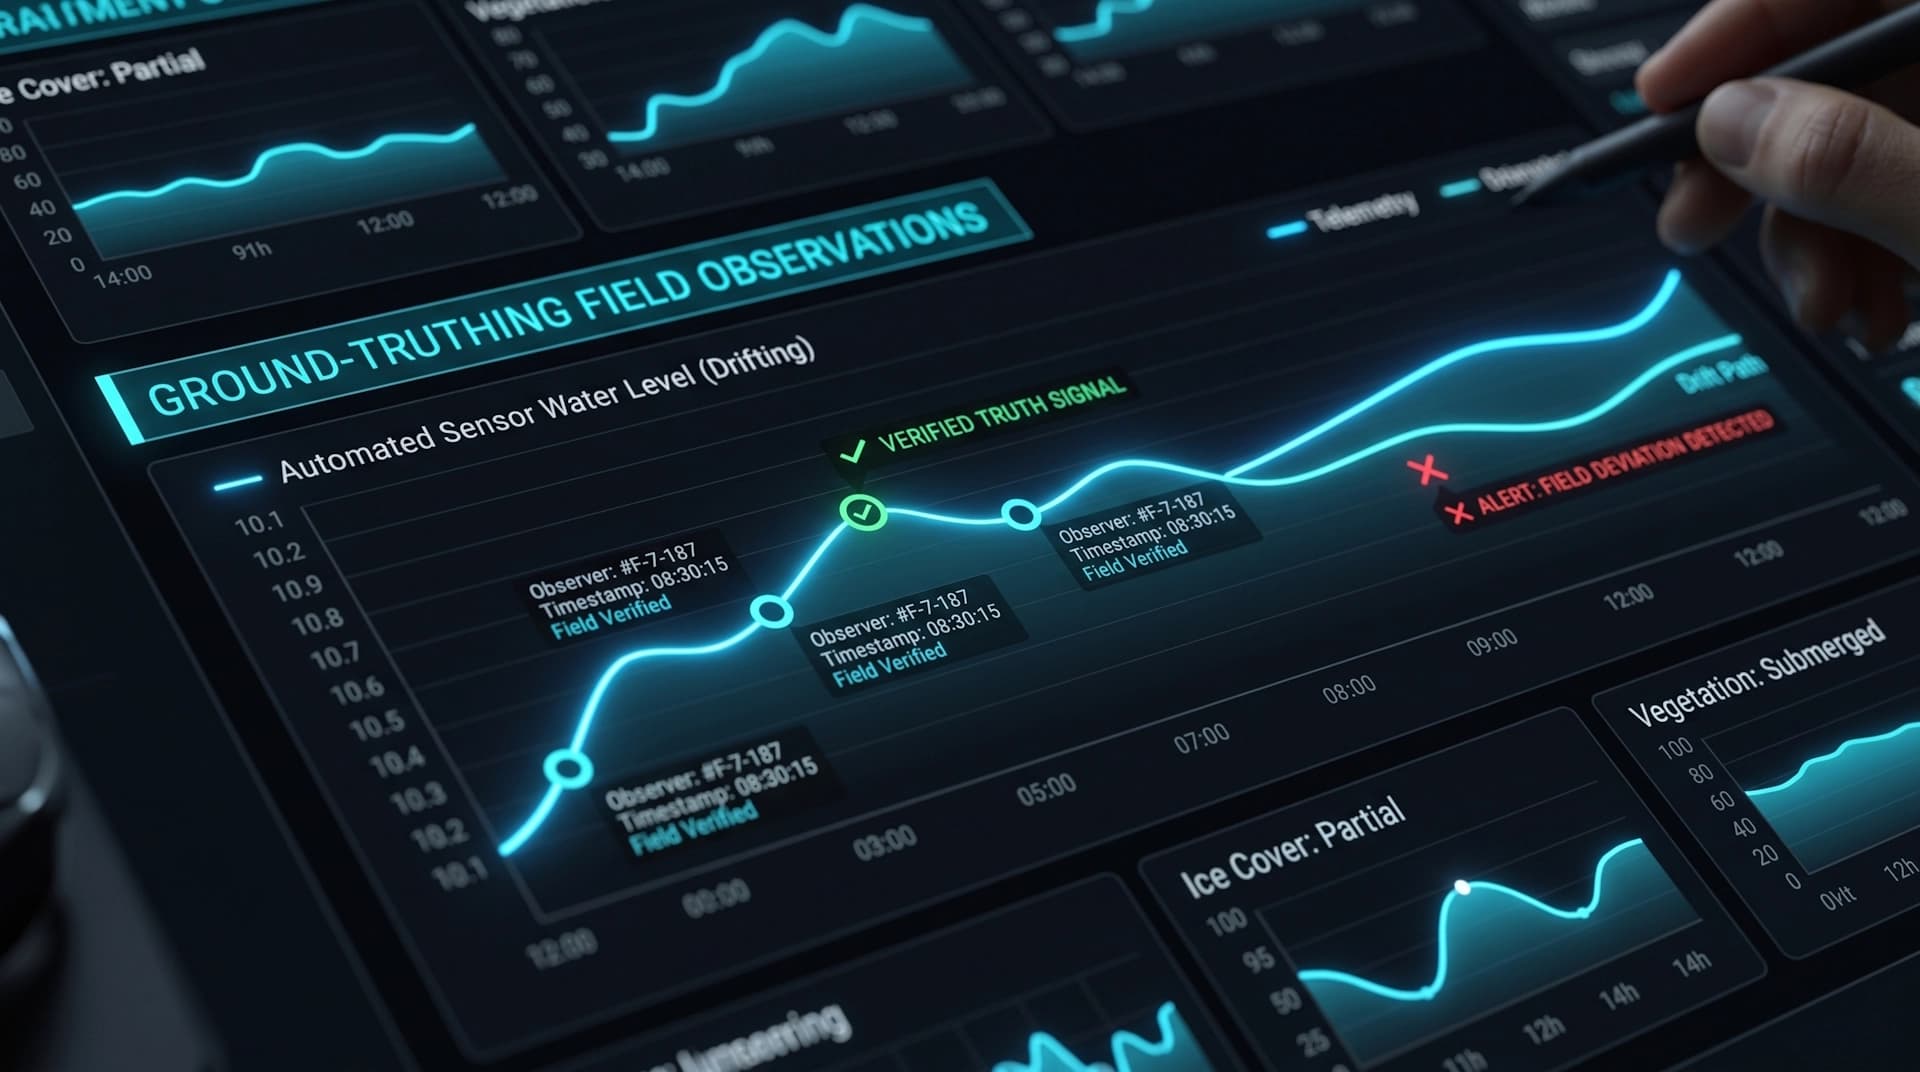
A field observation sitting in a separate table nobody opens is worthless. The entire value of the feature comes from where it is displayed: each submitted report renders as a marker directly on the same water-level chart as the sensor's automated readings, at its exact timestamp.
That single visual overlay does two jobs at once. When the marker lands on the sensor line, it is a confirmation - an at-a-glance, human-verified "this station is telling the truth" that no algorithm can produce on its own. When it lands off the line, it is an early warning that a specific station needs recalibration or physical maintenance, discovered in minutes rather than during the next scheduled audit, or worse, after a decision was made on bad data.
This is a different problem from the one we covered in designing for intermittency. That article is about making sure every reading a device produces actually reaches your database. This is about what happens after it arrives cleanly and is still wrong. Data integrity and data accuracy are not the same guarantee, and a platform needs a mechanism for both.
Beyond Water Level: A General Pattern
Nothing about this pattern is specific to hydrology. Any field network - air quality stations, soil moisture arrays, industrial process sensors - has staff visiting sites for maintenance who currently walk away without contributing a single bit of verification data. The marginal cost of capturing their observation is a form; the marginal value is a calibration signal you would otherwise only get from a full manual audit.
The next logical step, which we are already scoping into future work, is closing the loop automatically: when a field observation diverges from the sensor reading by more than a configured tolerance, trigger the same alert logic that watches for hardware failures - except this alert is watching for hardware that is lying, not hardware that is silent.
Sensor networks are usually evaluated on uptime and connectivity, but a sensor that is online, connected, and quietly wrong is a worse failure than one that is honestly offline. Putting field staff's own eyes back into the data pipeline - cheaply, structurally, and visibly on the same chart as the automated readings - closes a gap that no amount of hardware-agnostic architecture, the kind we described in our vendor lock-in article, can close on its own. See the full Observer flow in context in the Wodowskaz case study.