
Real-time Telemetry:
Monitoring Poland's
Hydro-Meteo Data.
We designed and developed a dedicated web application for visualizing and archiving telemetry data. The system aggregates real-time measurements from scattered stations (Hydro/Meteo) onto a single interactive map, providing historical analysis and a robust admin panel for technical monitoring of the infrastructure. Under an ongoing retainer, the platform has kept growing - from water-quality telemetry and tiered data access to scheduled reporting and field-verified data trust - and the client has since signed on for continuous maintenance and support. Ready to dive deep into the details? Let's go.
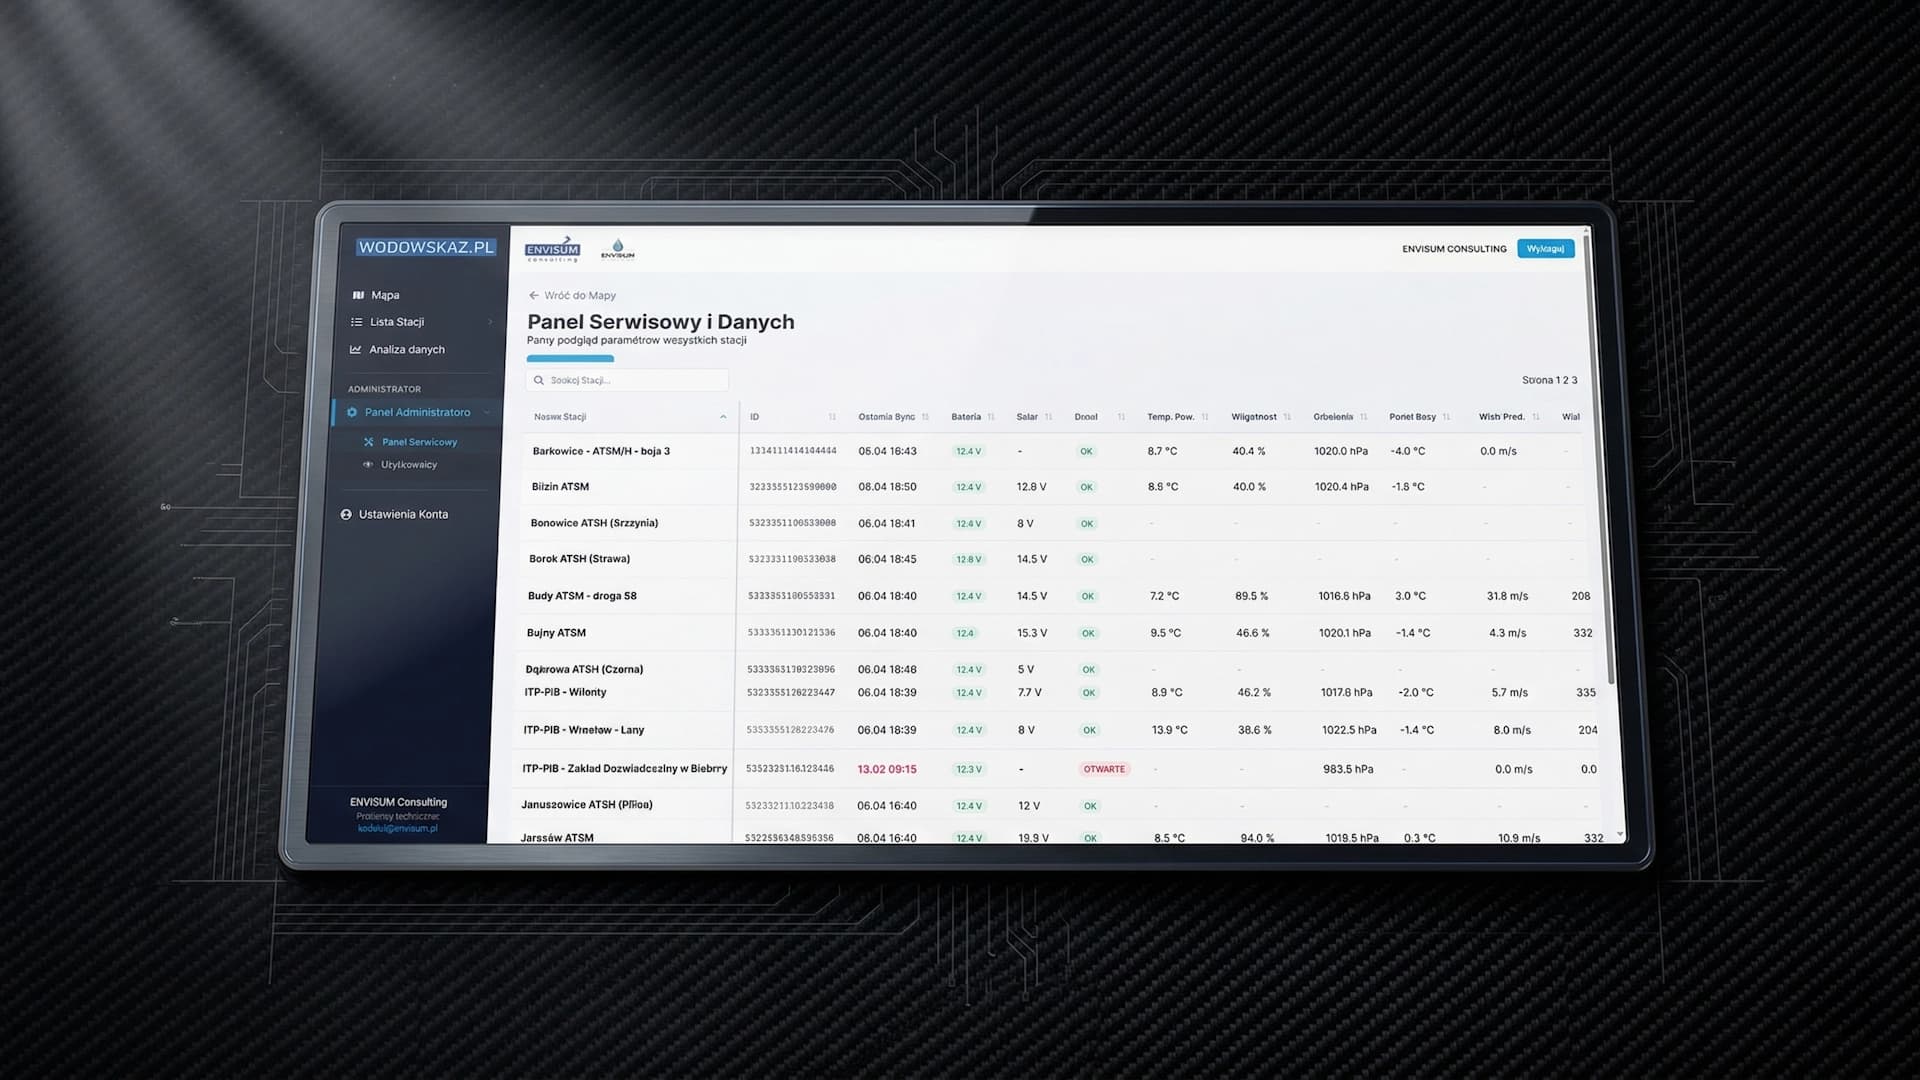
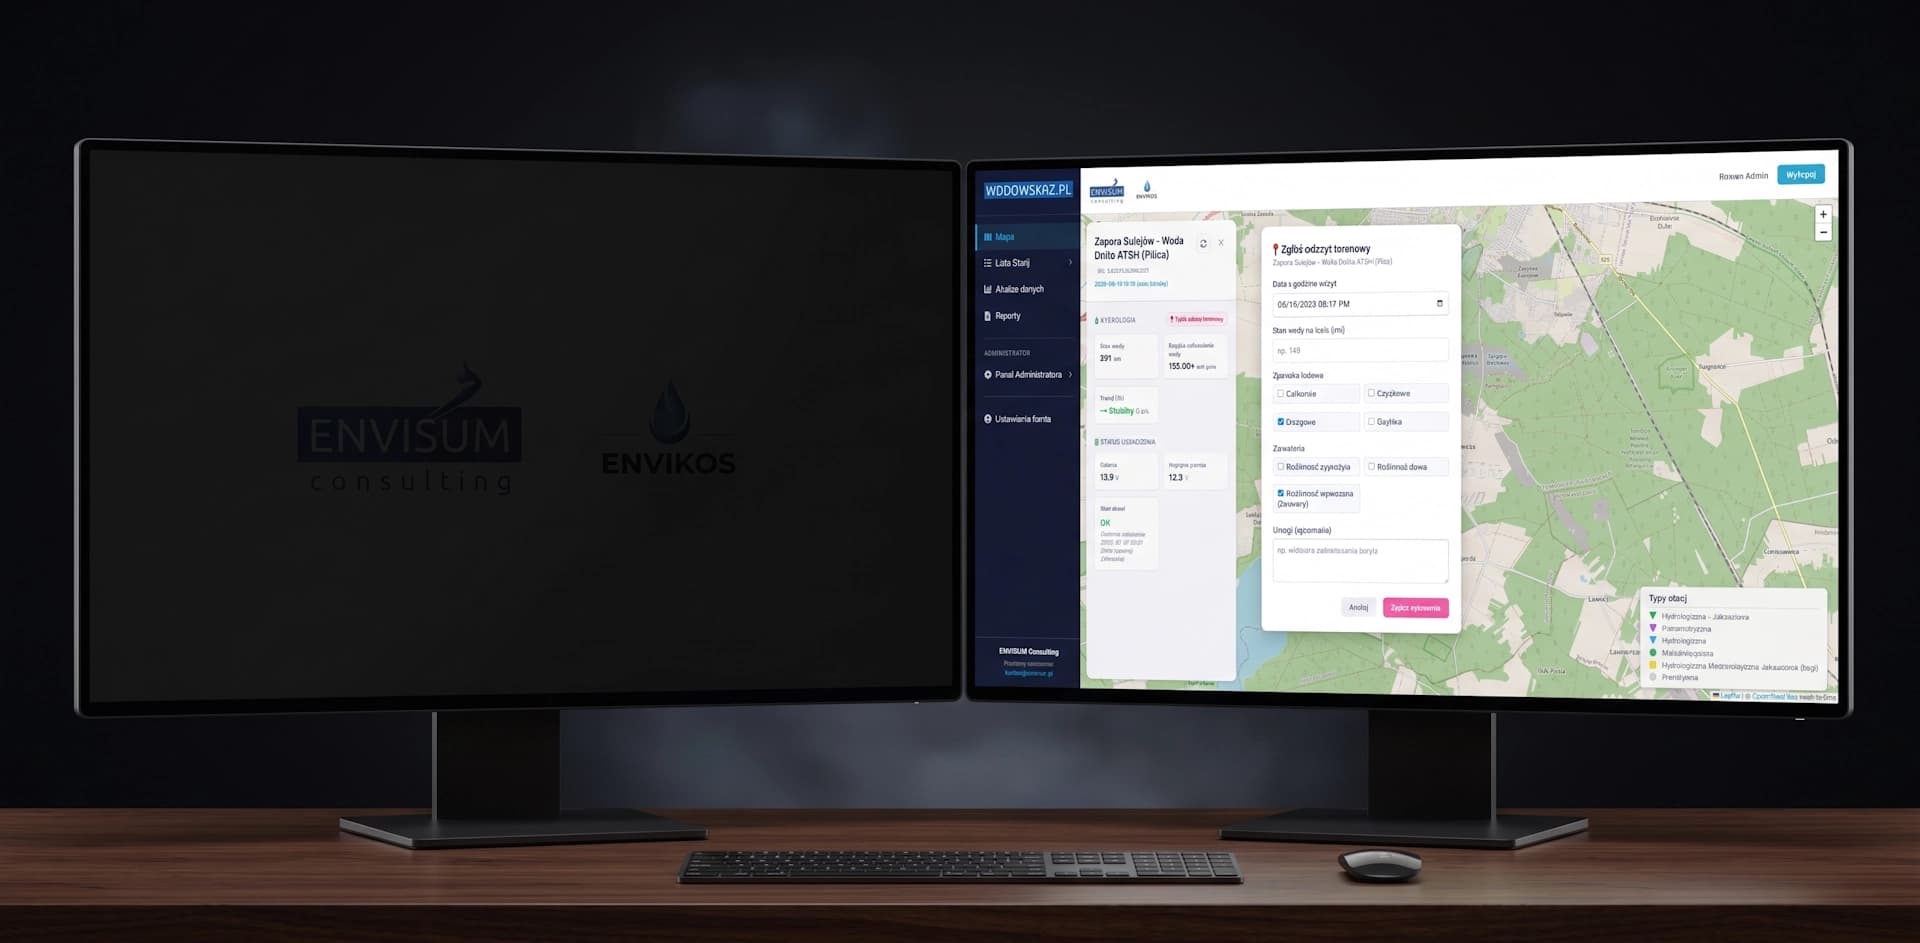
The client needed a centralized platform to manage a growing network of telemetry stations. The goal was twofold: allow authorized users to easily check current weather and water conditions via an interactive map, and give administrators a powerful tool to monitor the "health" of the stations (battery voltage, door status, solar panel efficiency) without visiting them physically.
A major strength of Silentbits is their deep technical expertise and ability to translate complex challenges into business-oriented solutions. The system operates reliably, is fast, and very well designed from a user experience perspective.

The Challenge.
Complex Data Synchronization
The client faced data gaps due to unstable GSM connectivity. Standard "last hour" fetching was insufficient because stations often buffered data offline during outages and sent it hours later ("Store and Forward" mode).
Critical Incident Response
Rapid reaction to exceeding alarm thresholds (e.g., river flooding) was required, but the system had to be immune to false alarms caused by temporary sensor glitches.
Data Clarity vs. Density
Displaying different units (e.g., rainfall in mm vs. water level in cm) on a single screen risked creating visual chaos, hindering quick IMGW-style analysis.
Multi-Vendor Hardware Fragmentation
The monitoring network has grown to span six incompatible hardware ecosystems - from API-based sensors to legacy FTP/CSV feeds from third-party water-quality stations. Each vendor uses proprietary data formats and communication protocols, creating isolated data silos with zero native interoperability.
Performance & Scale
Aggregating thousands of measurement points - unified from six separate vendor ecosystems - and visualizing them on real-time charts without degrading UI performance.
Hardware Monitoring
Transforming raw technical logs into clear, actionable alerts for the maintenance crew to prevent hardware failures.
Multi-Stakeholder Data Access
Different user groups - regulators, field crews, managers - required access to different data subsets. Universal access created compliance risk and information overload for non-technical users.
Trusting Automated Sensors in the Field
Remote sensors can drift or fail silently, under- or over-reporting water levels for hours before anyone notices. The client needed a way to cross-check live readings against real-world, in-situ observations - matching the ground-truth verification standard used by Poland's official IMGW gauge network.
Tiered Data Access Without Exposing the Business Model
The client wanted to offer an extended historical data range as a paid upgrade, while standard and premium users browsed the exact same interface - with no visible hint to free users that anything was being withheld.
Manual Reporting Didn’t Scale
Stakeholders across dozens of stations needed recurring summaries for specific parameters, time ranges, and recipients. Producing these by hand, station by station, was unsustainable as the network grew.
Login Friction on Public Kiosks
A public information board needed to let passersby view live station data instantly by scanning a QR code, without typing credentials on a shared, unsecured device, while keeping that access fully isolated from the rest of the platform.
The Solution.
Interactive Dashboard
We built the core using Next.js for a fast and responsive frontend. The heart of the system is an interactive map where clicking a station reveals instant data and customizable charts (24h/7d/30d/All).
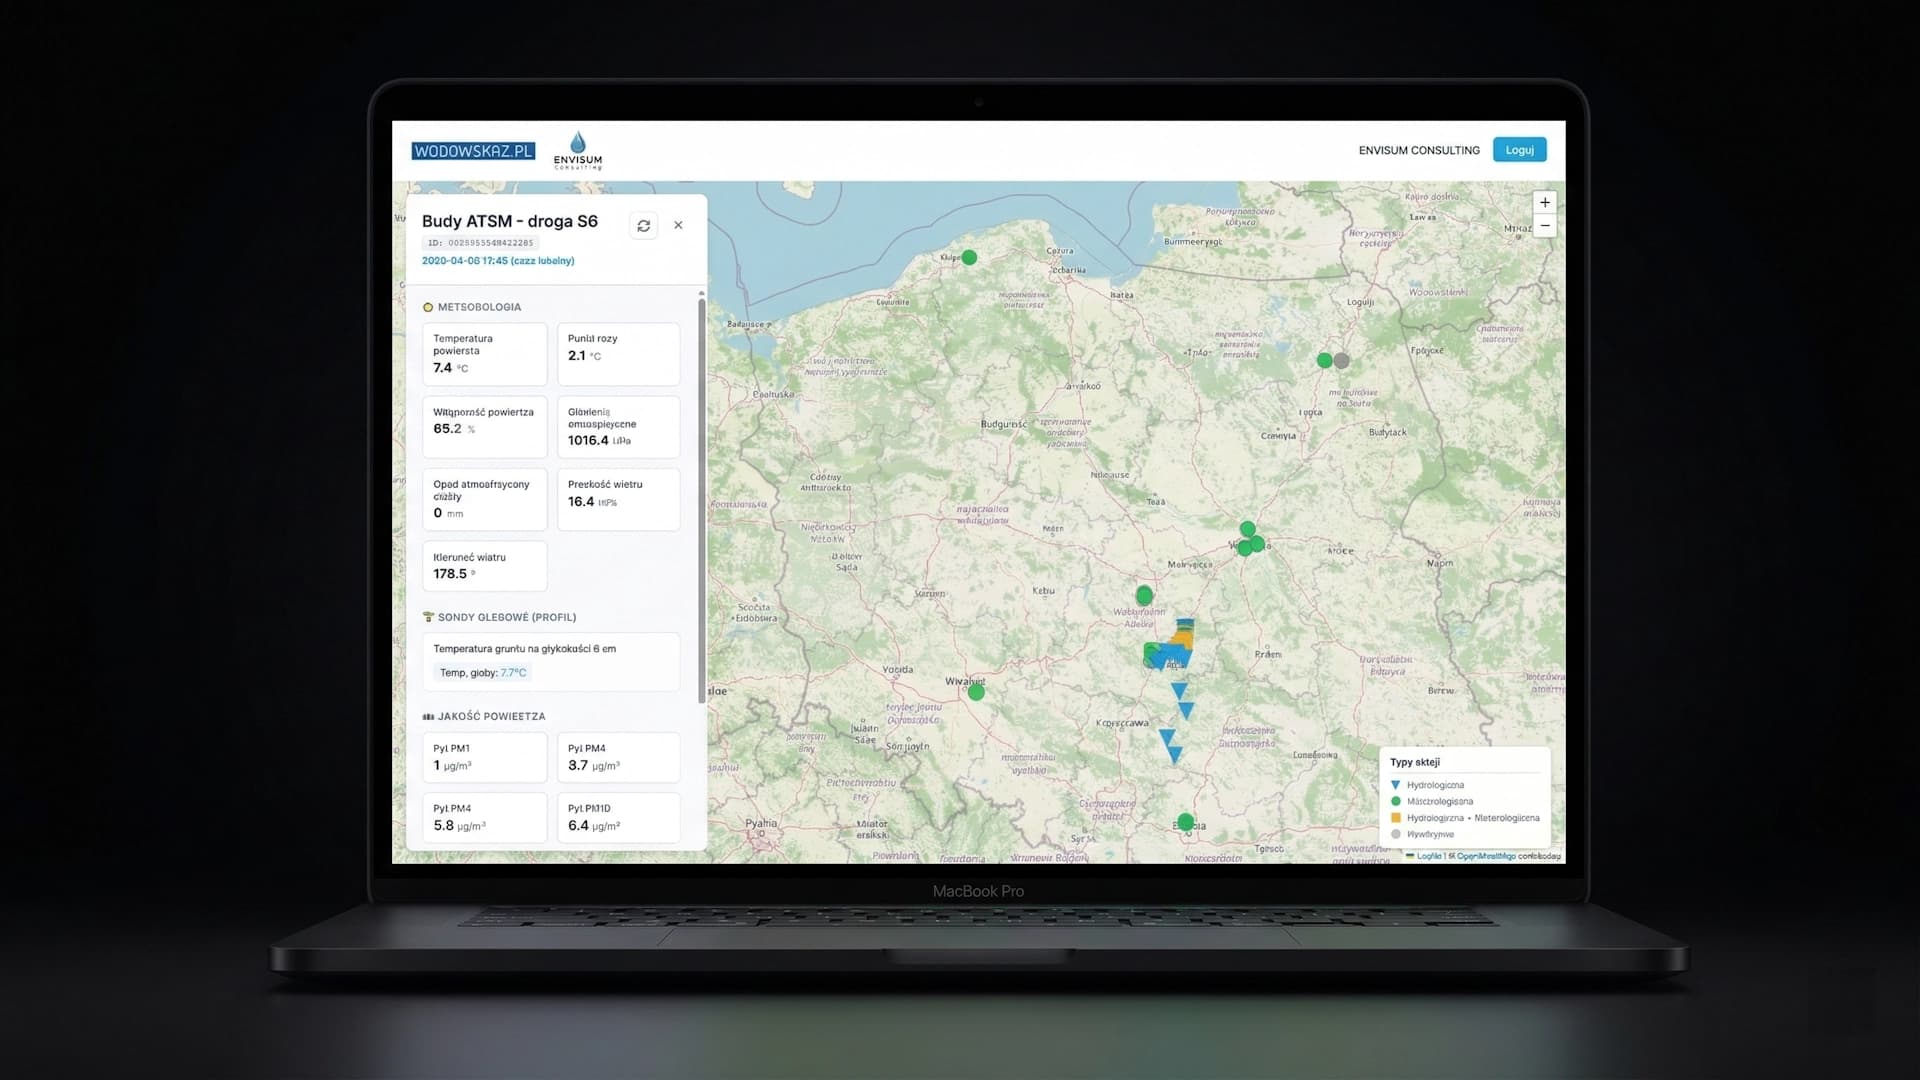
Automated SMS Alerting Engine
We designed a reliable backend state machine integrated with an external SMS API. Administrators gained a panel to independently configure warning and alarm thresholds, while the system automatically filters data noise, dispatching alerts only during real threats.
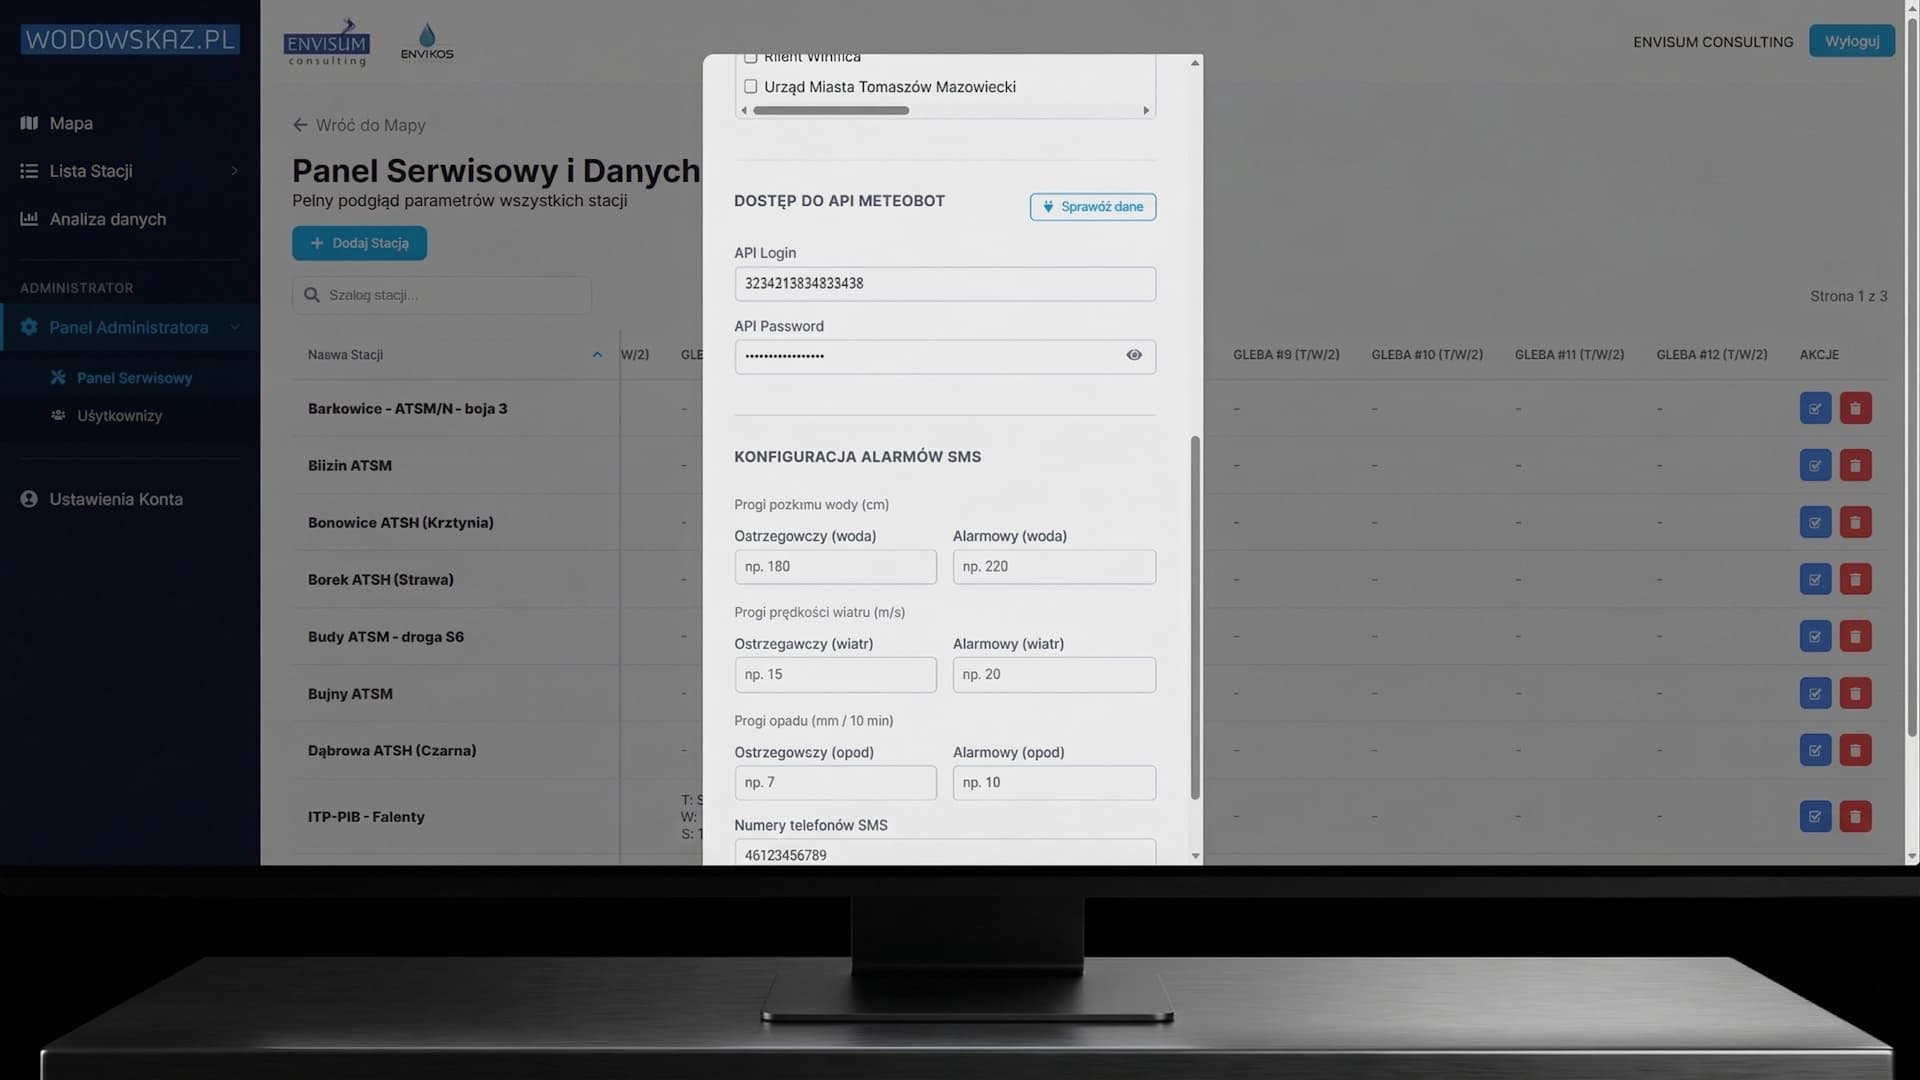
Industrial-Grade Analytics
We implemented advanced dual-axis charts to seamlessly compare different measurement units. Users can interactively zoom in on data and access a comprehensive statistics panel (trends, absolute min/max with dates, zero elevation) modeled after professional meteorological standards.
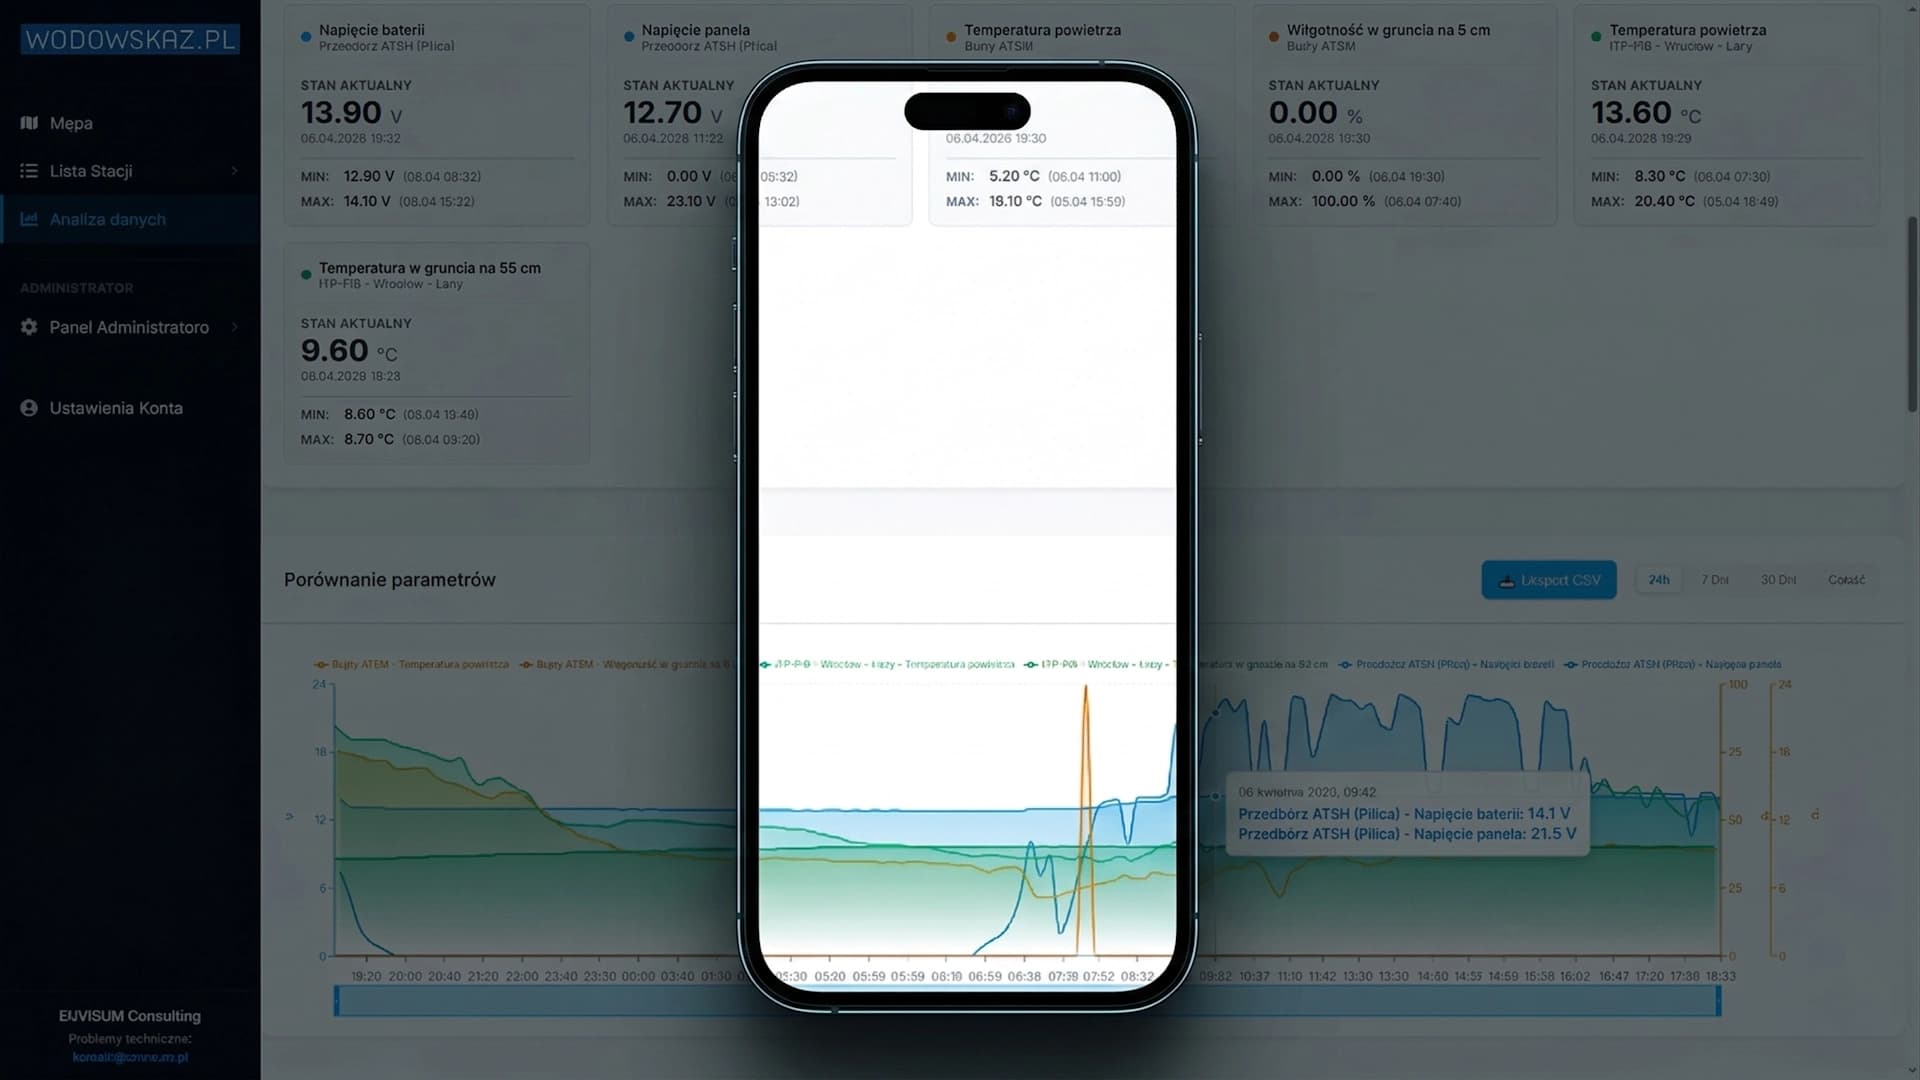
48h Micro-Detail View & History
We expanded the UI to include a detailed 48-hour preview chart triggered by clicking any specific measurement tile, alongside a structured historical data table (06 UTC / full hours views) for deep-dive analysis.
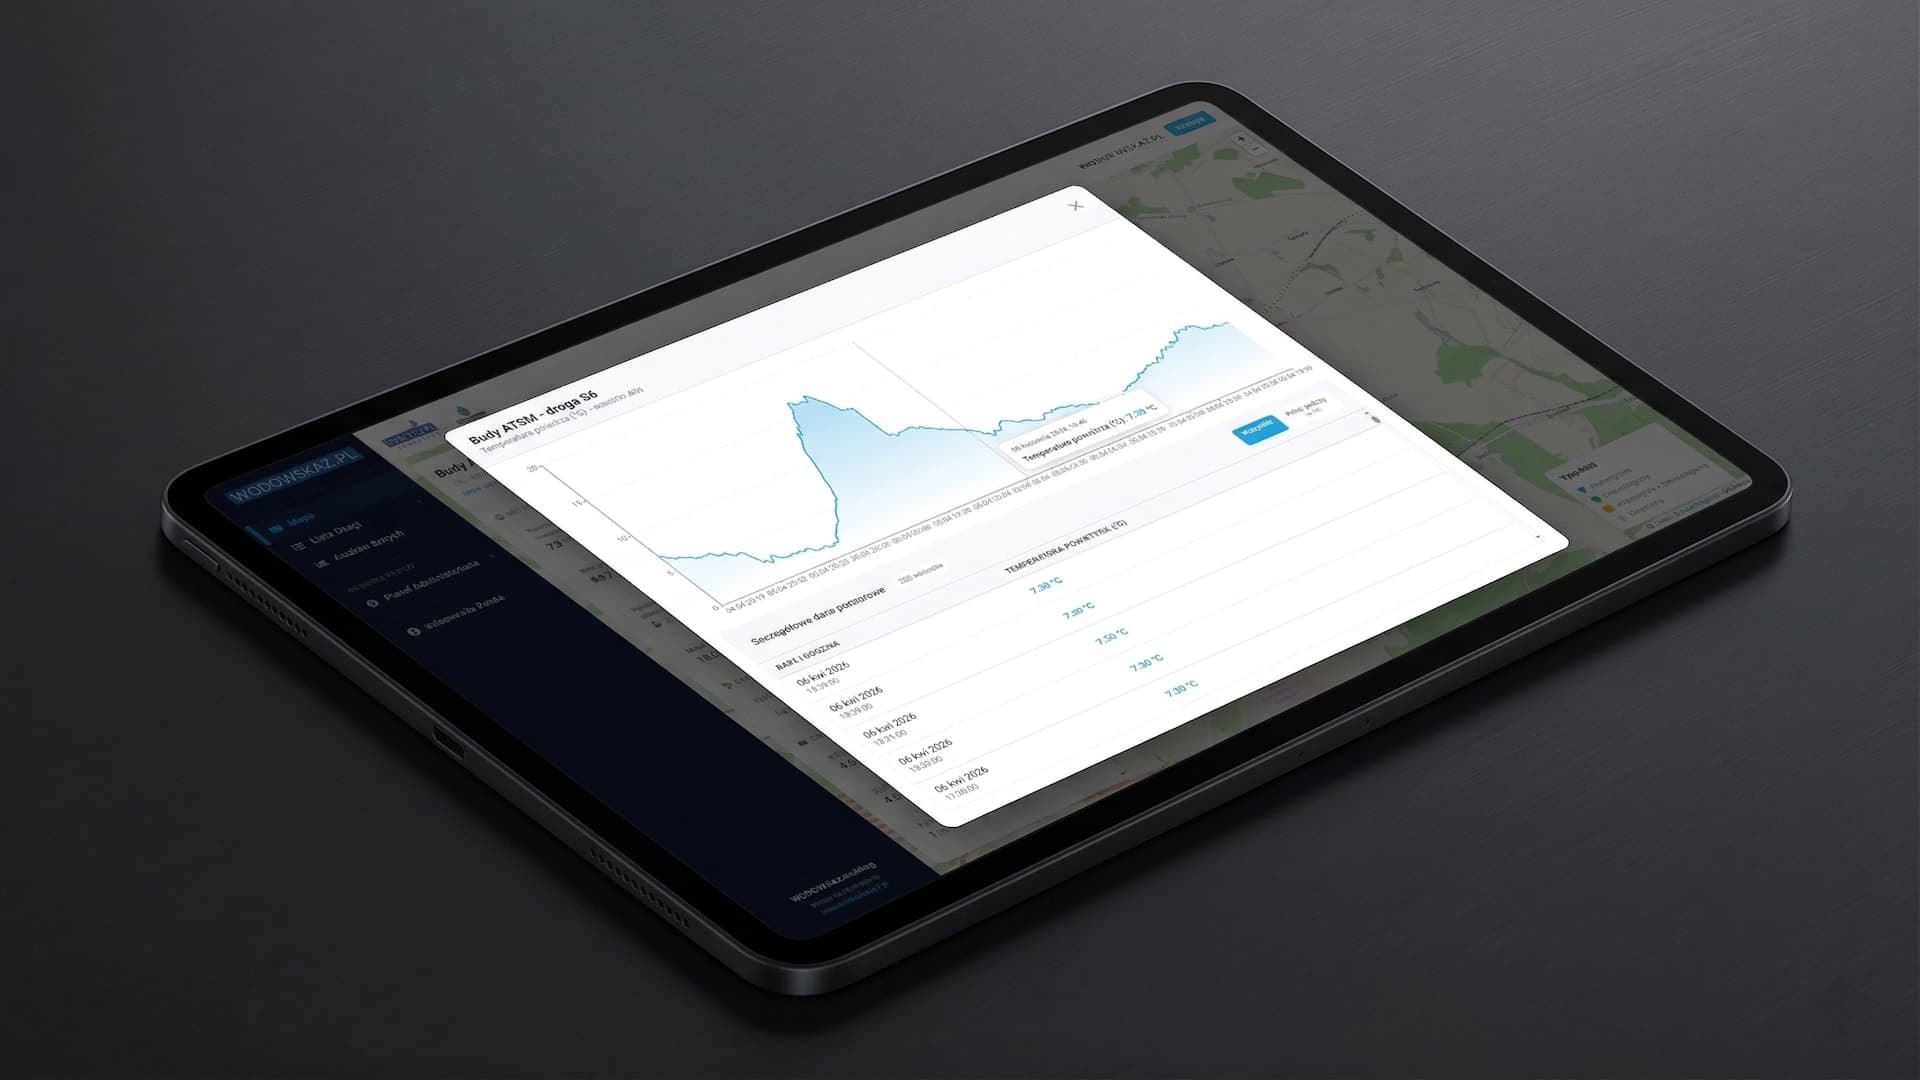
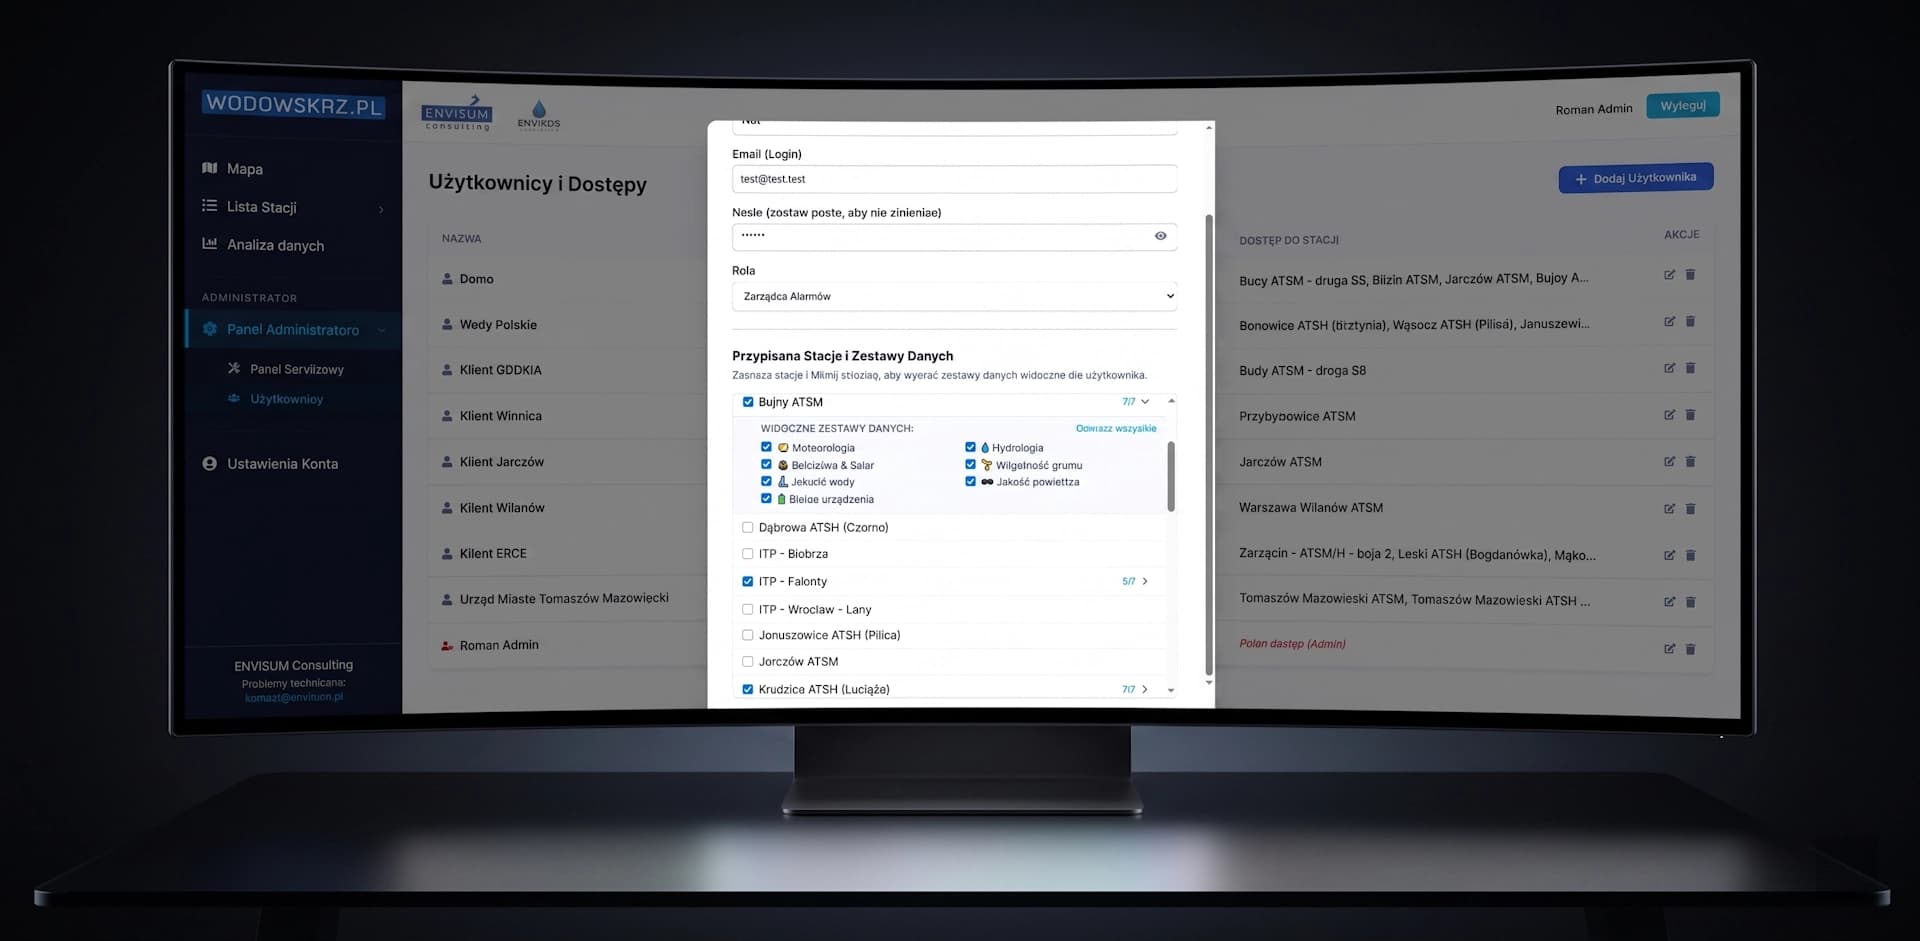
Granular Permission Engine
We built a role-based access control system allowing administrators to define exactly which data categories each individual user can view and export - down to specific stations and parameters, not just broad roles. A field technician sees device health metrics; a regulator sees water quality readings; a client-created sub-account can manage SMS alert thresholds without ever touching station configuration - all from a single, unified platform.
Smart "Watermark" Scheduler
Instead of simple periodic fetching, we implemented a dynamic synchronization algorithm. The backend remembers the timestamp of the last successful record for each station and automatically "backfills" any missing history once the connection is restored. This ensures 0% data loss and makes the system self-healing without manual admin intervention.
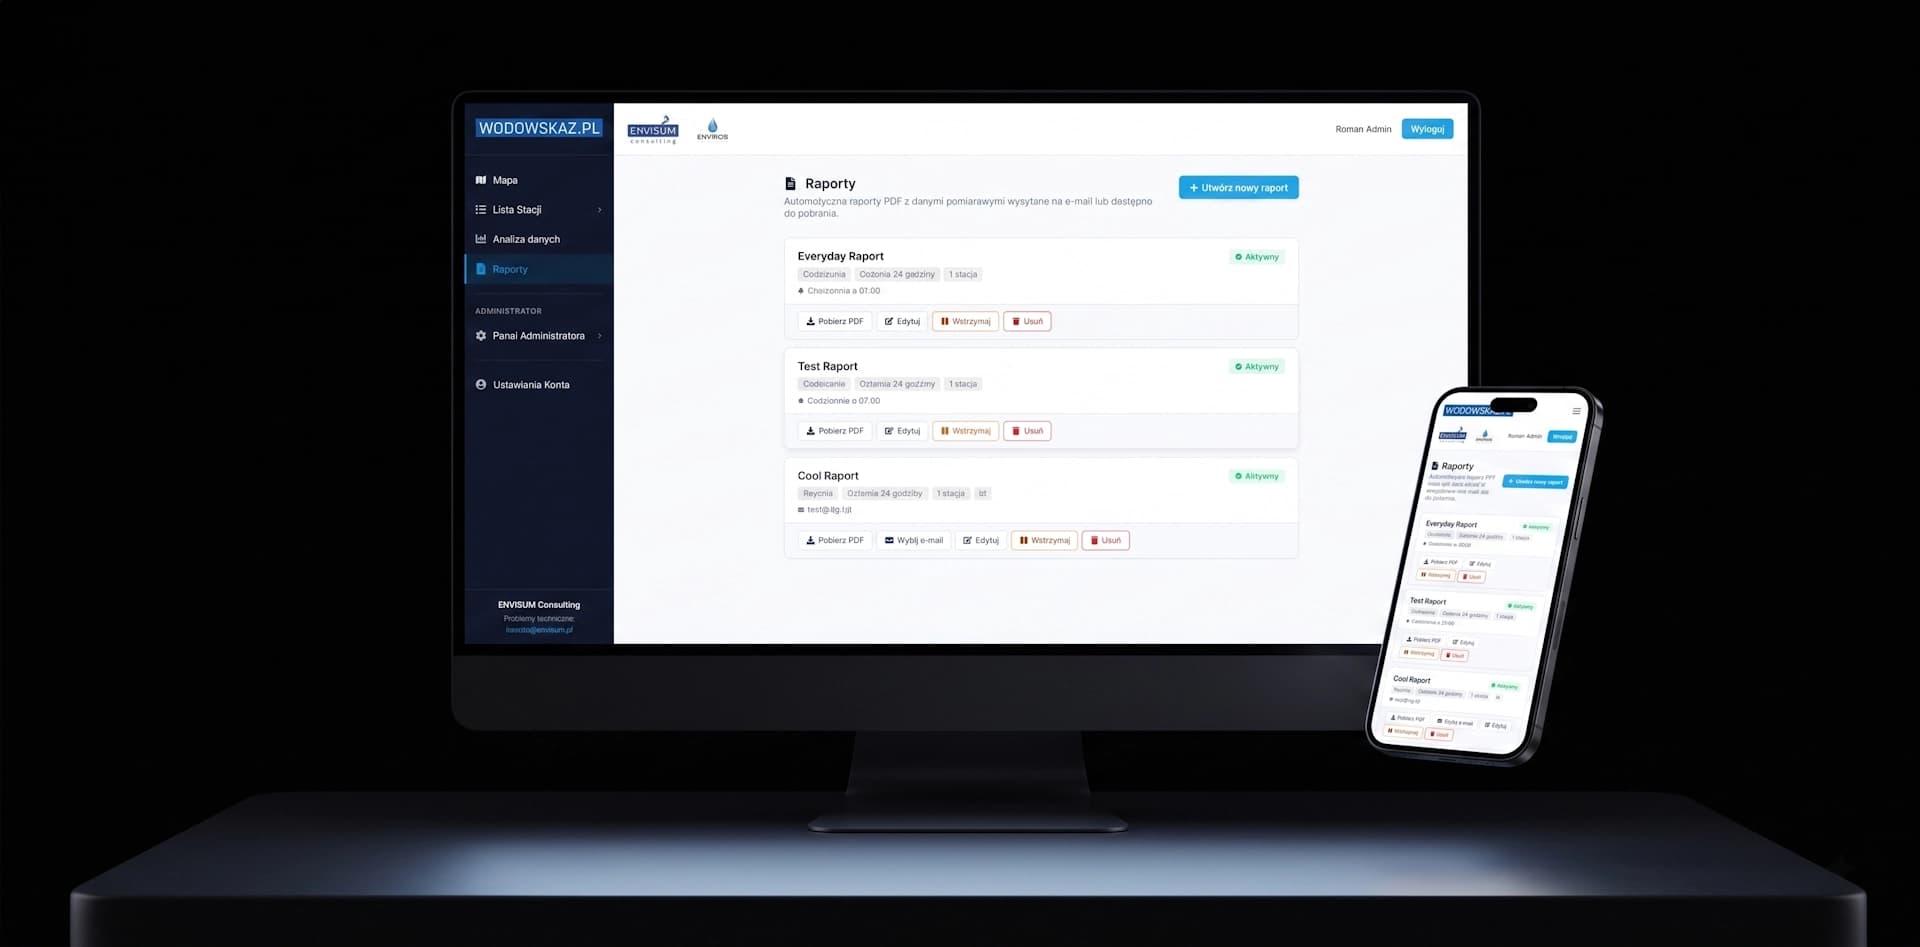
Scheduled Report Builder
We built a report-configuration engine letting users define recurring PDF reports - stations, parameters, time range, and recipients - generated automatically on a schedule and branded with the client's logo, or produced on demand for a custom date range and sent by email or downloaded directly.
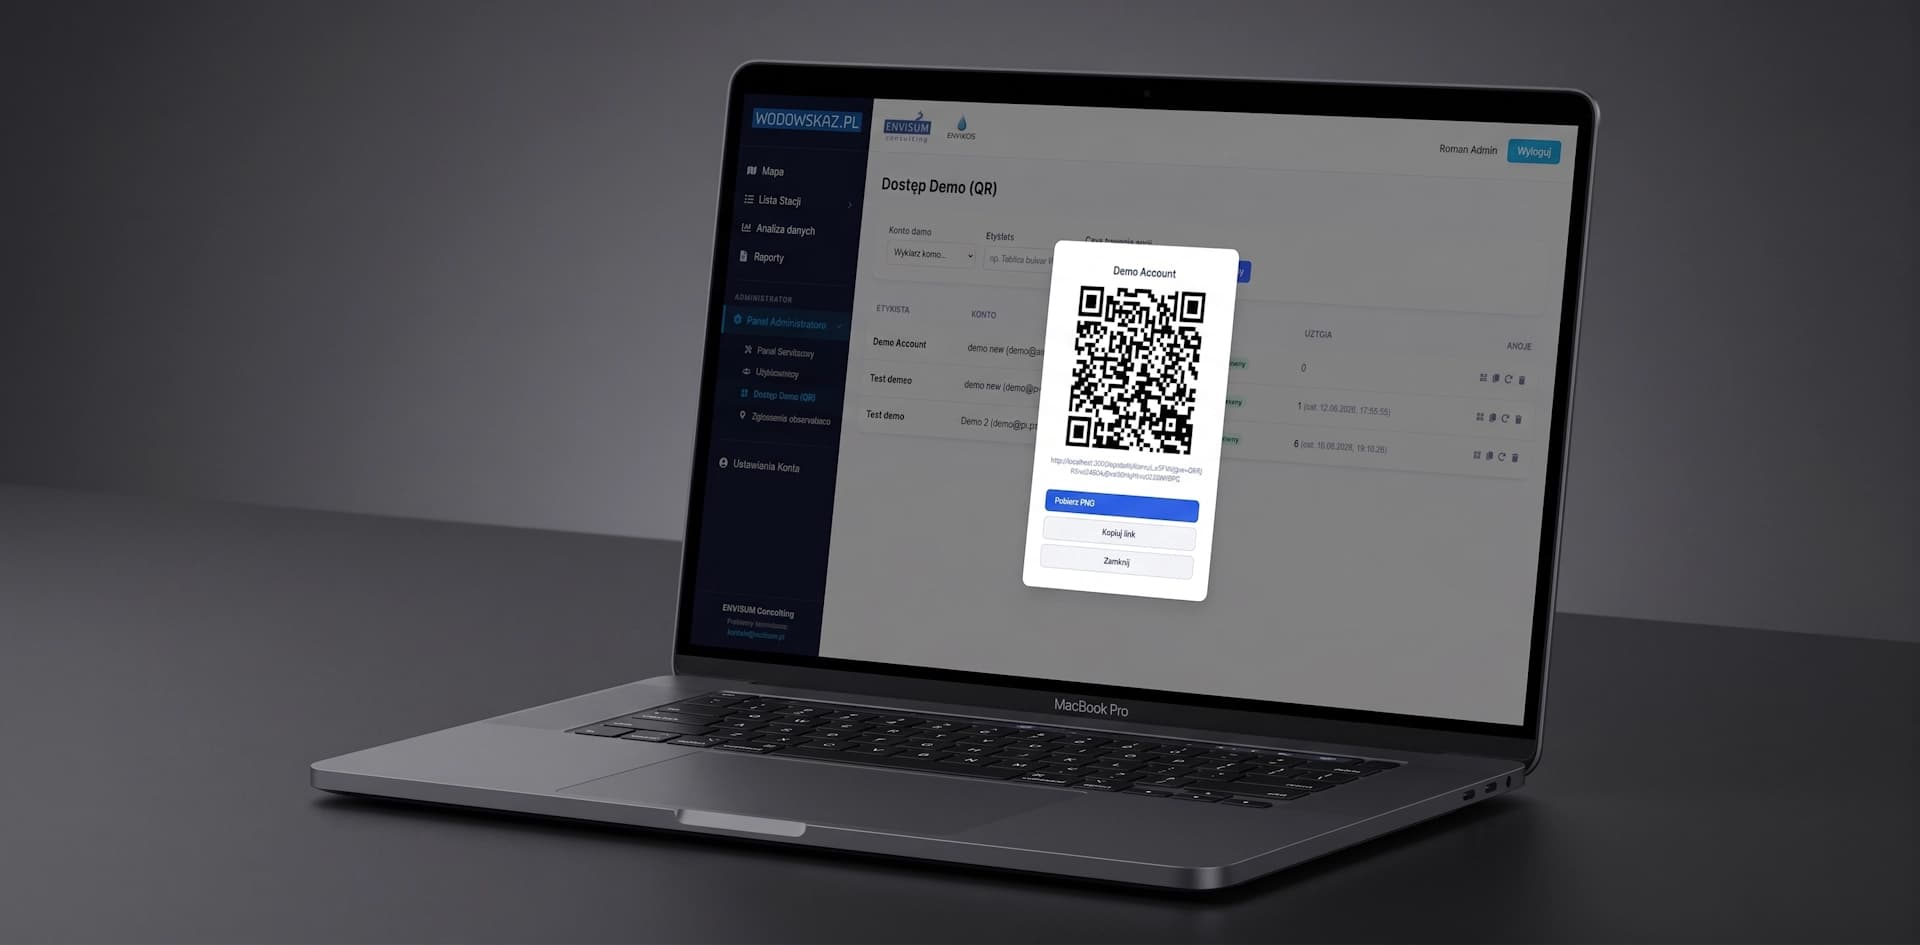
QR Auto-Login Kiosk
We built a scoped session provisioner triggered by a signed URL parameter. Scanning the QR code on a public information board drops visitors straight into a sandboxed demo view of the local stations - no login screen, no password, and no visibility into the rest of the platform.
Field Verification ("Observer")
We added an in-app Observer flow, on web and mobile, letting field staff log an on-site water-level reading with a timestamp. Each report renders as a marker directly on the water-level chart - giving users and administrators an at-a-glance, IMGW-style confirmation that a sensor reading matches reality, or an early signal that a station needs recalibration.
Technology Used.
HydroScope
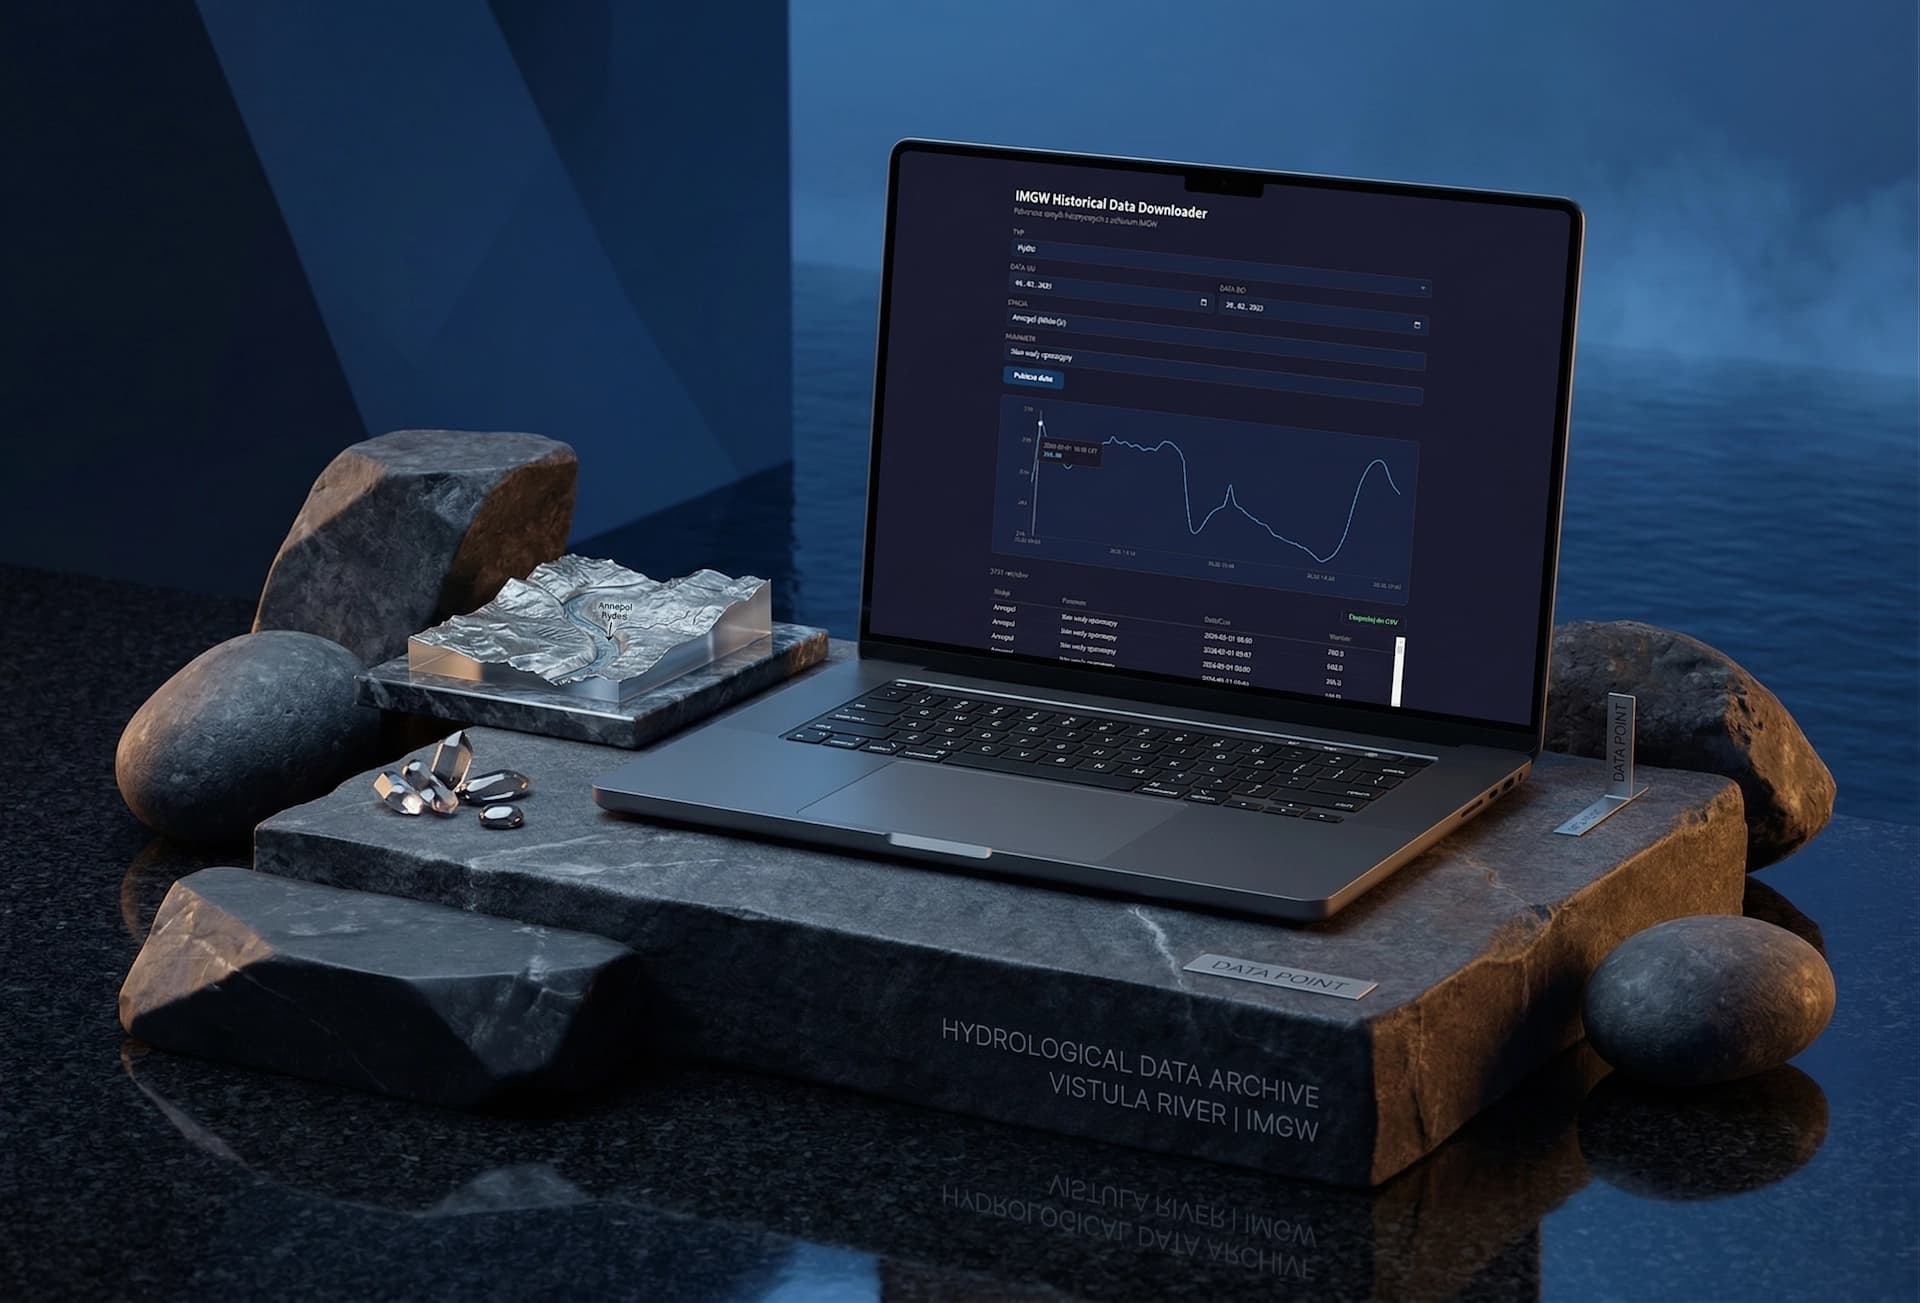
Automated environmental data acquisition desktop tool - translating raw IMGW station feeds into decoded, analysis-ready exports with built-in trend visualization.
Ironman Athletic Club
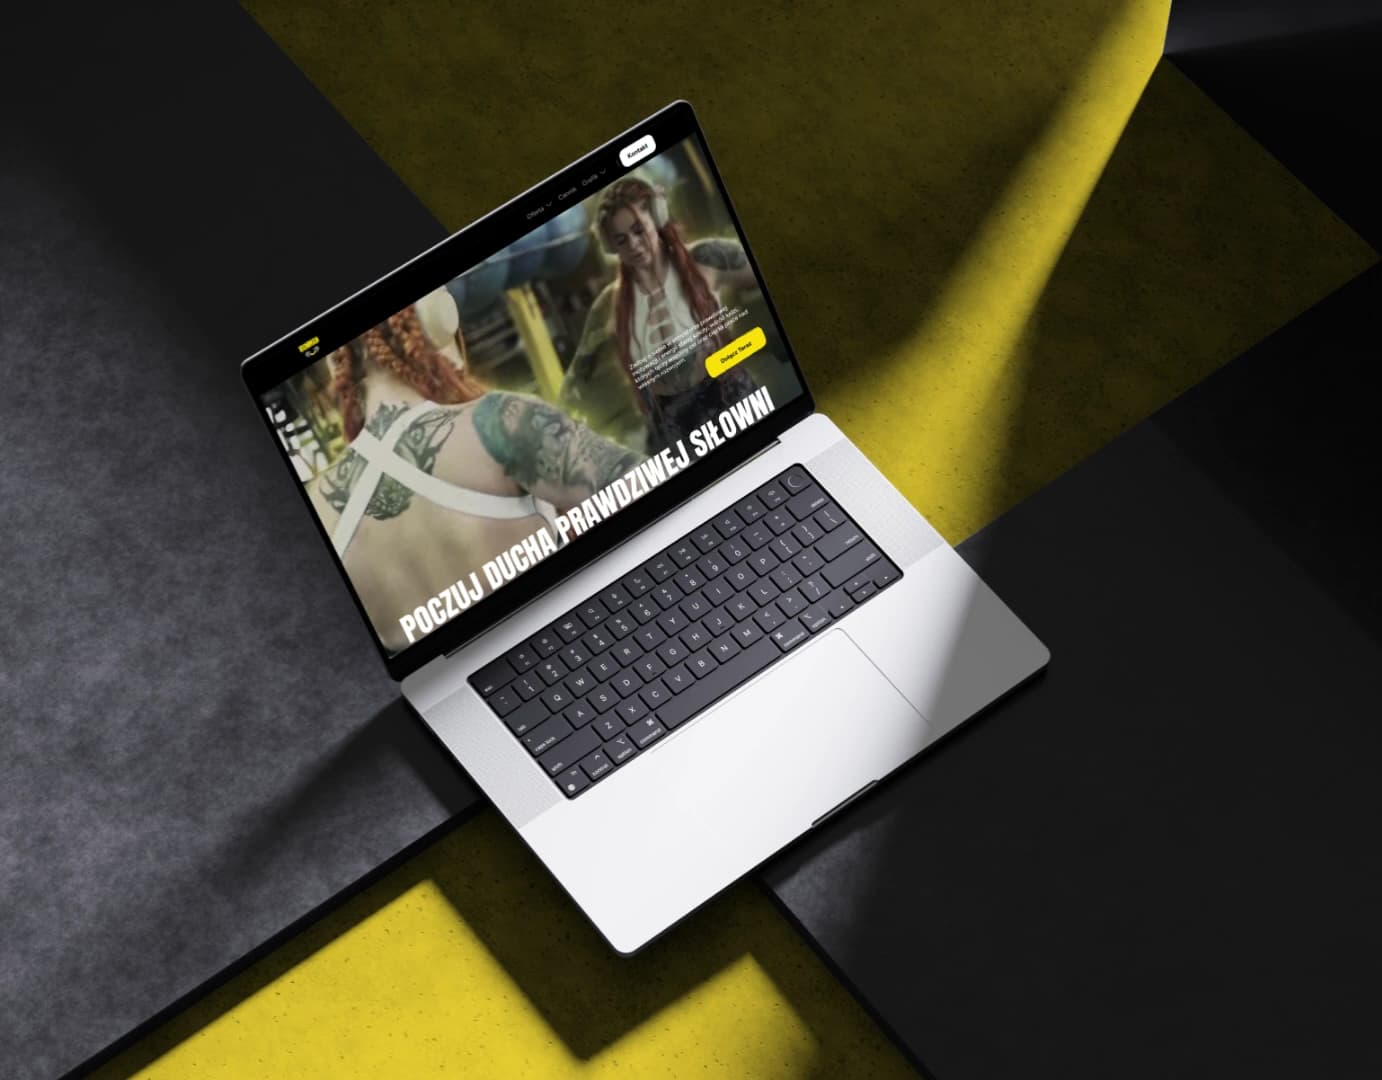
High-throughput digital architecture engineered for peak performance, traffic scalability, and seamless user conversion.