
HydroScope: Automated
Environmental Data
Acquisition & Visualization.
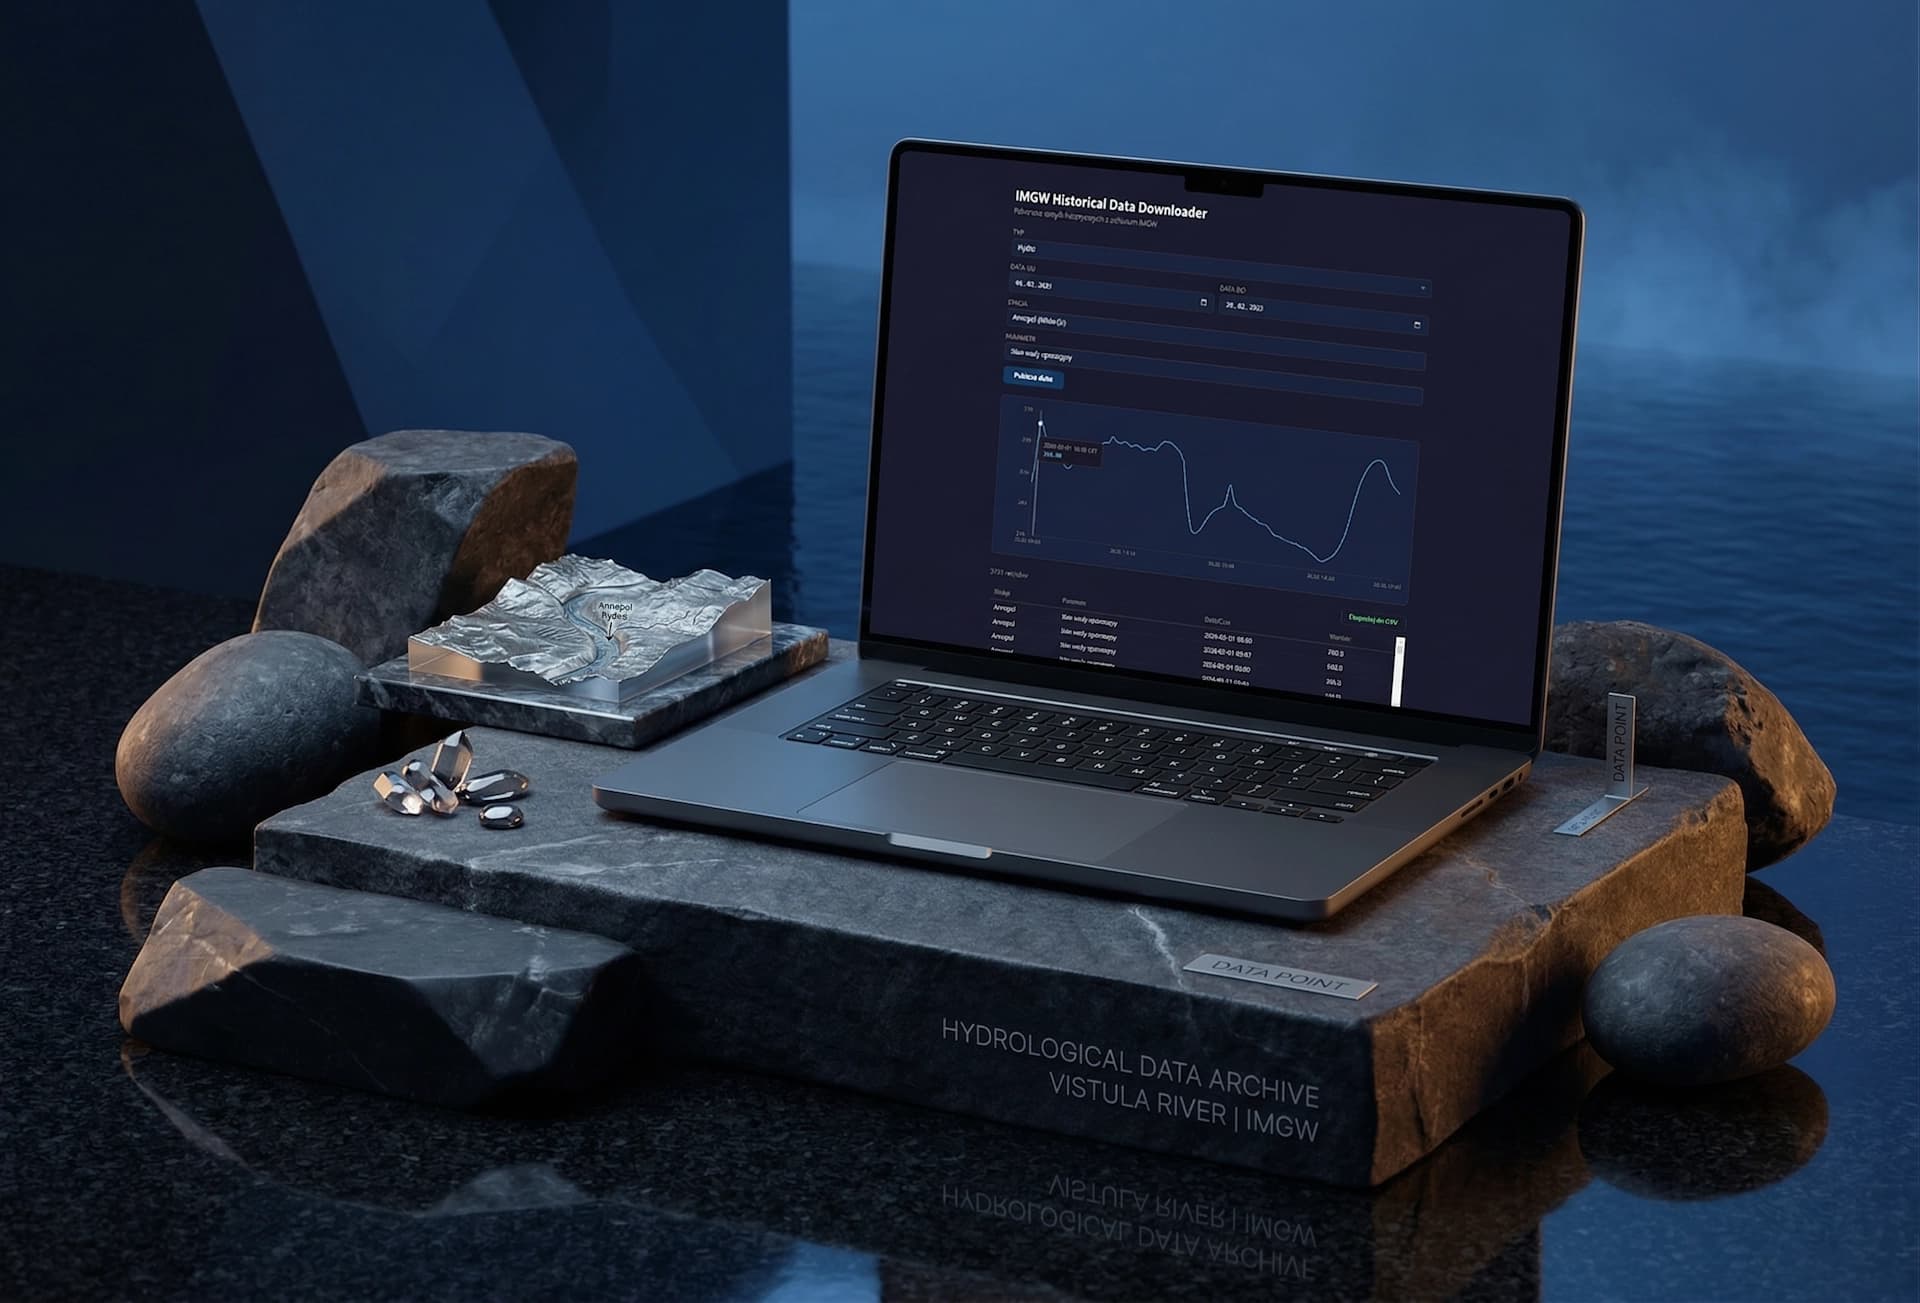
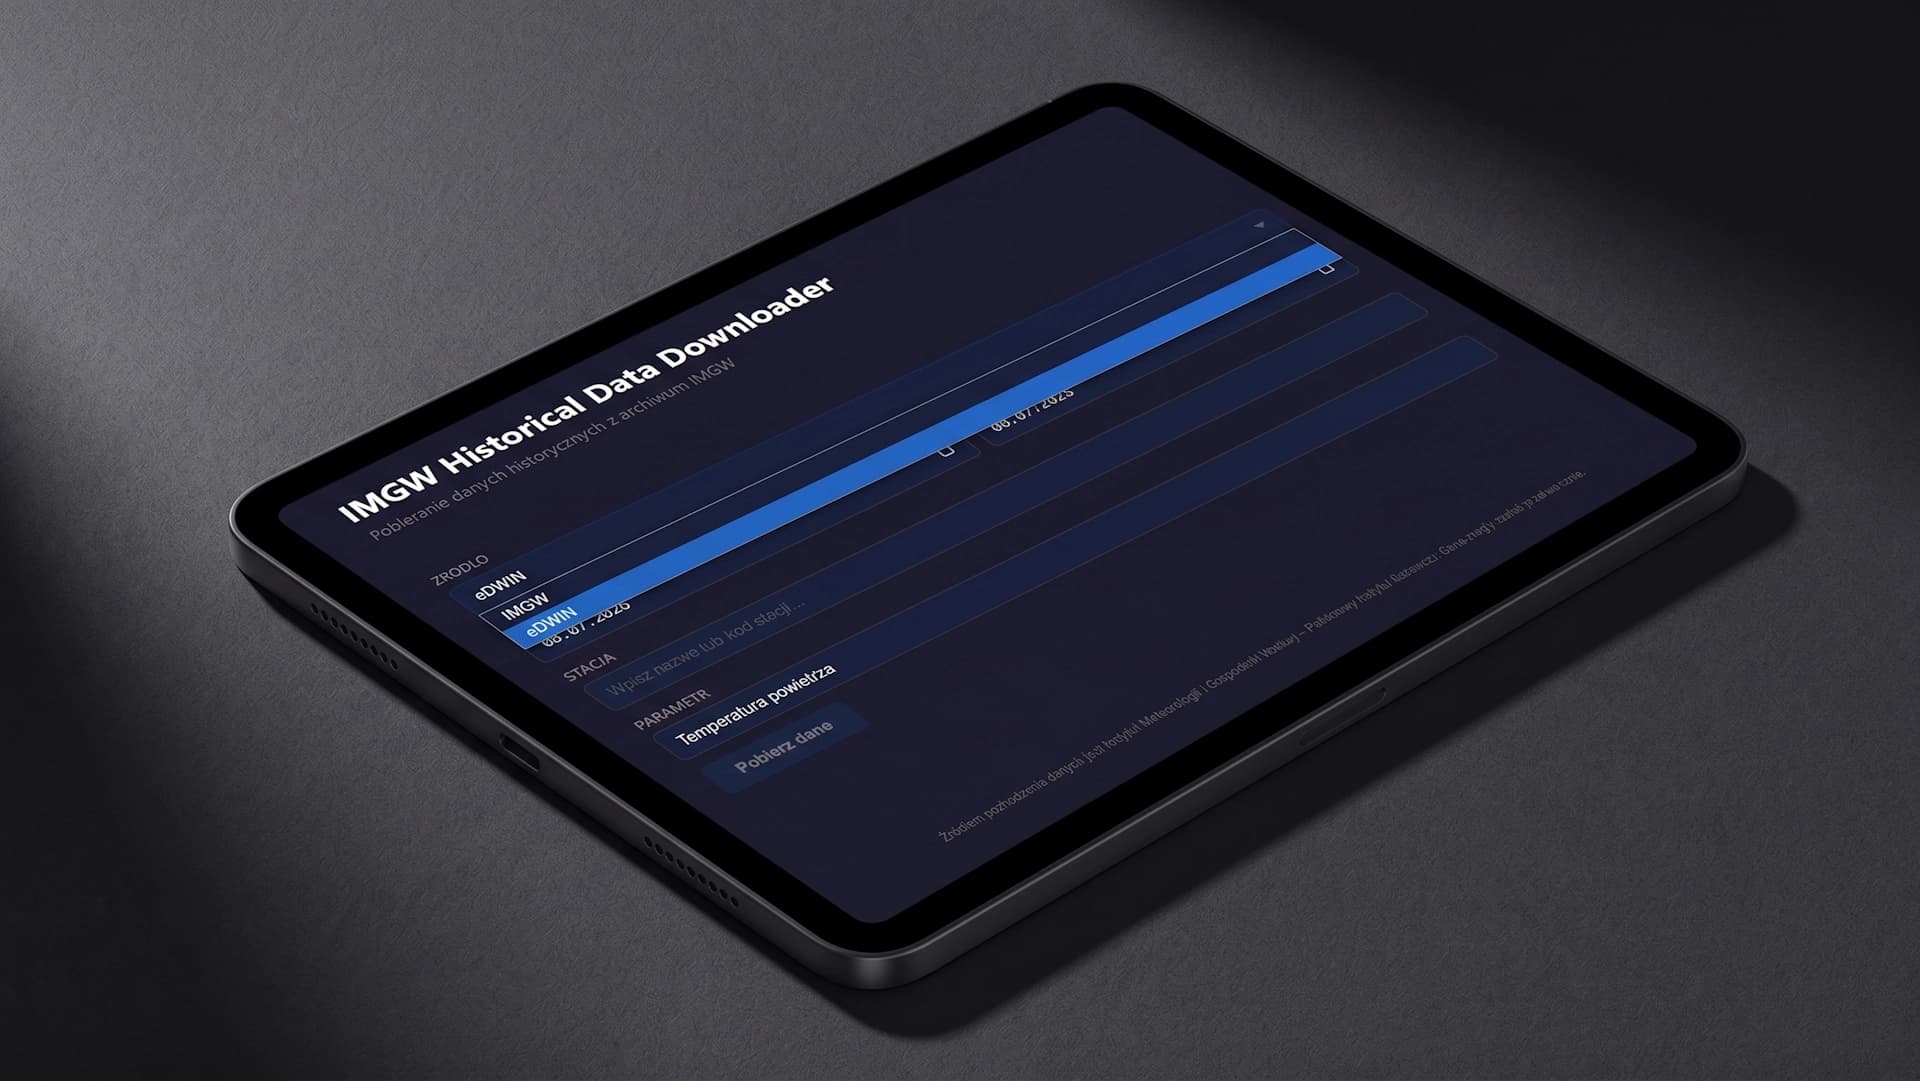
We engineered a bespoke, standalone desktop tool to automate the tedious extraction and translation of historical IMGW (Institute of Meteorology and Water Management) data. The application replaces manual archive parsing with a streamlined, single-screen interface that downloads, decodes, and visualizes raw environmental telemetry instantly. The tool has since been extended with a second data source - agricultural telemetry from eDWIN - reusing the same table and chart components behind a simple source switcher. Ready to see the workflow? Let's jump in.
The client was wasting countless hours manually hunting for station codes, unzipping IMGW archives, and mapping raw phenomenon codes to readable formats in Excel. The goal was to build a local, lightning-fast desktop executable that automates this entire pipeline, delivering clean CSV exports and instant visual trend analysis without relying on external servers.
The Challenge.
Fragmented Raw Data
IMGW historical archives are notoriously hostile to quick analysis-hidden behind cryptic database codes, nested ZIP files, and scattered parameters.
Human-Readable Translation
Automating the mapping of raw phenomenon IDs (e.g., rainfall, temperature) and numerical station codes into plain-text names without requiring a complex backend infrastructure.
Immediate Visual Feedback
The client needed to verify data trends instantly before exporting to Excel, requiring a lightweight, built-in charting engine within a standalone, single-screen desktop environment.
Preserving Investment While Expanding Scope
Adding a second, structurally different data source risked forcing a rebuild of the already-paid-for table and chart components, or spinning up a separate, redundant application entirely.
Divergent API Contracts
The new source's API returned multi-parameter payloads in a different shape than IMGW, paginated in 90-day windows instead of monthly blocks - incompatible with the existing chunking logic and parameter dictionary out of the box.
The Solution.
Serverless Desktop Engine
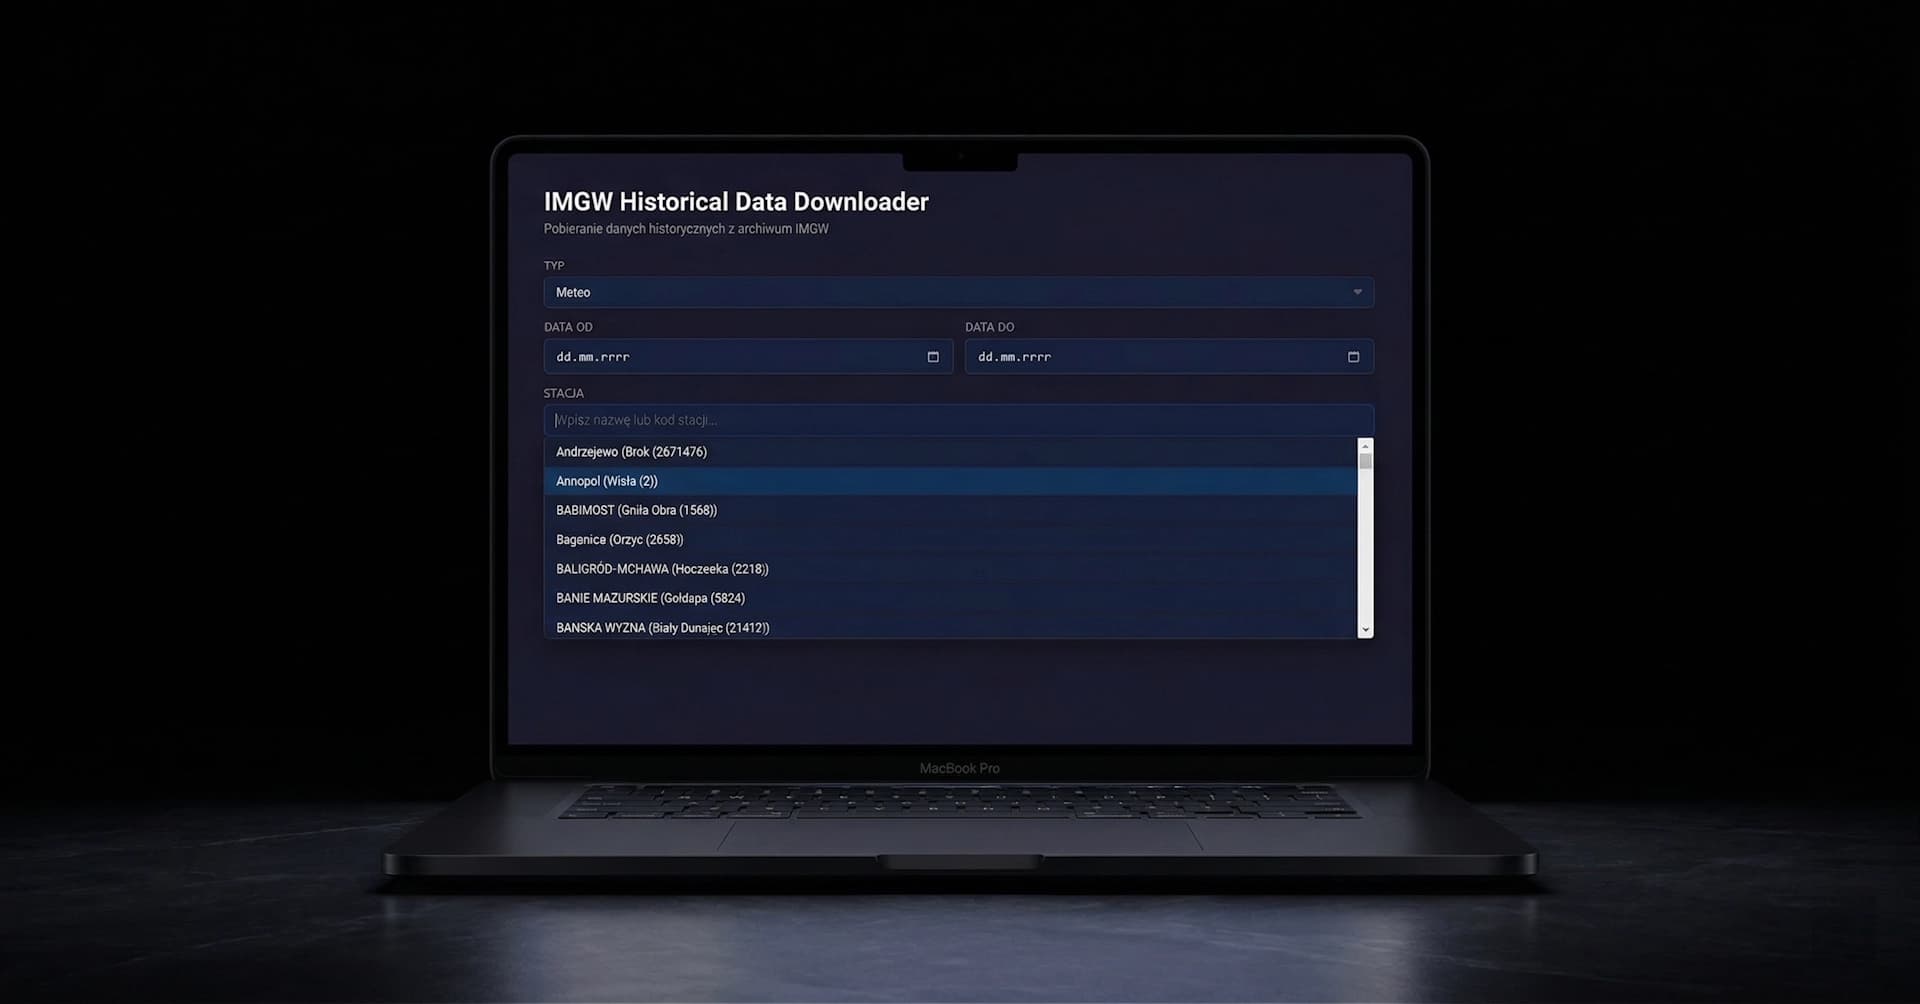
We built a standalone desktop application tailored for local execution. Users simply select dates and search for stations by name (e.g., "Szczecin" instead of cryptic IDs), and the software handles the extraction, parsing, and data mapping entirely locally.
Automated CSV Pipeline
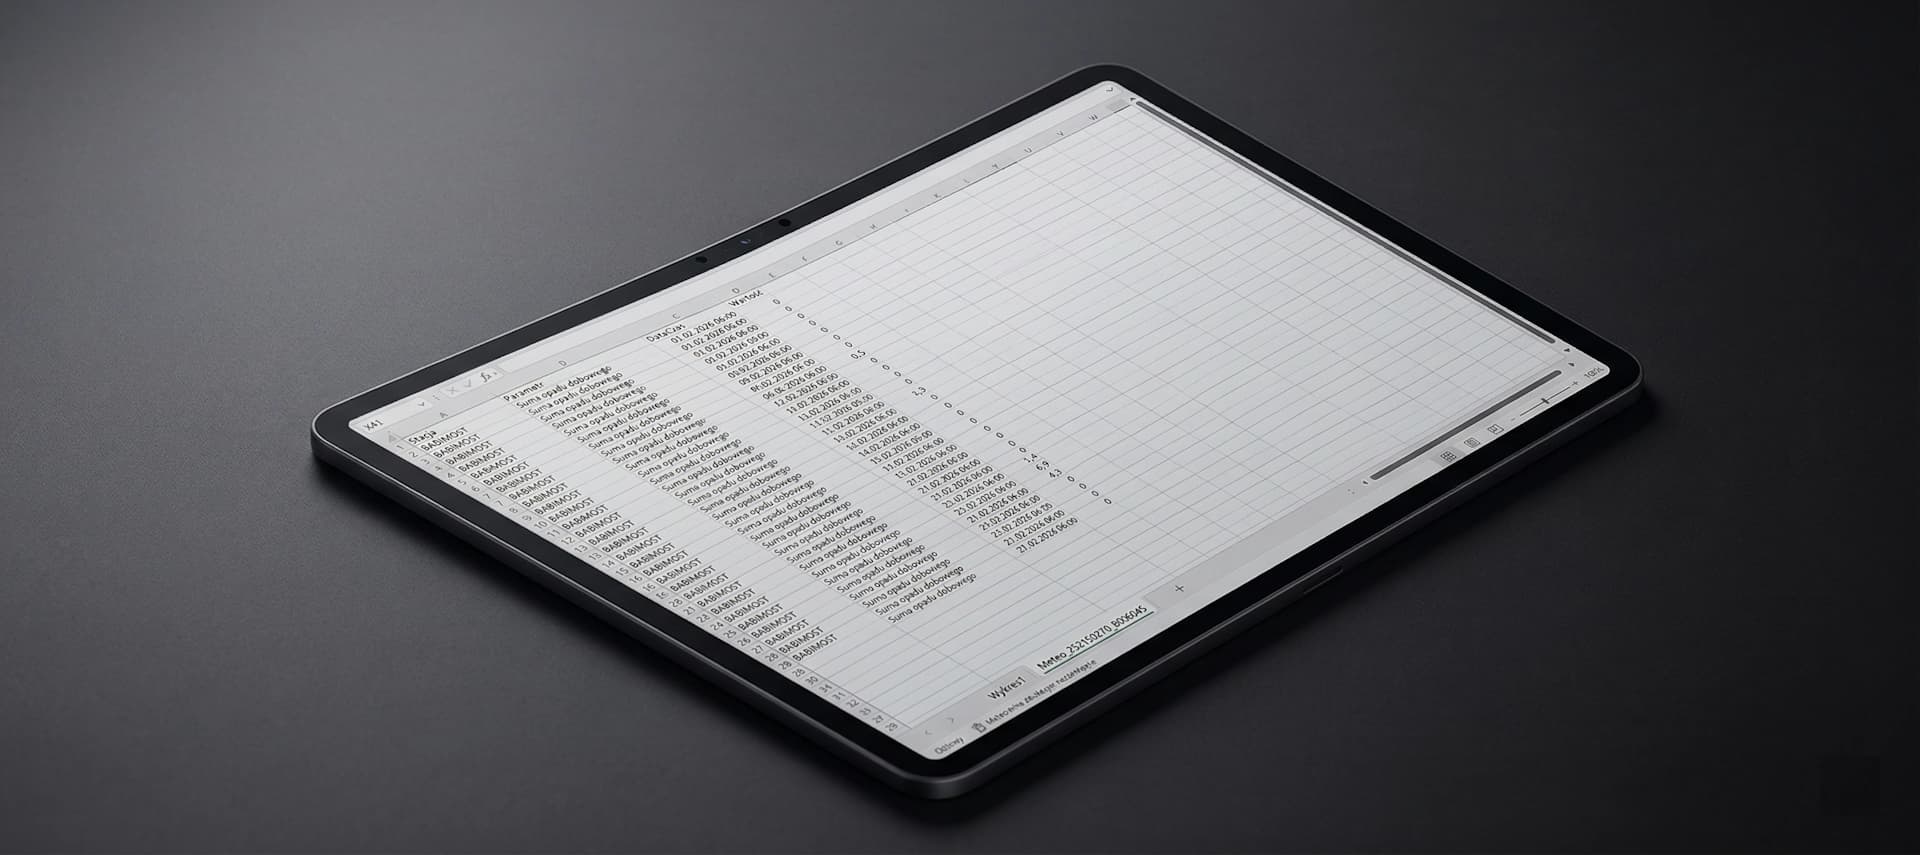
The core engine automatically translates raw IMGW codes into human-readable labels, outputting structured, analysis-ready CSV files. This eliminated manual Excel formatting, turning a multi-hour chore into a one-click process.
Instant Trend Visualization
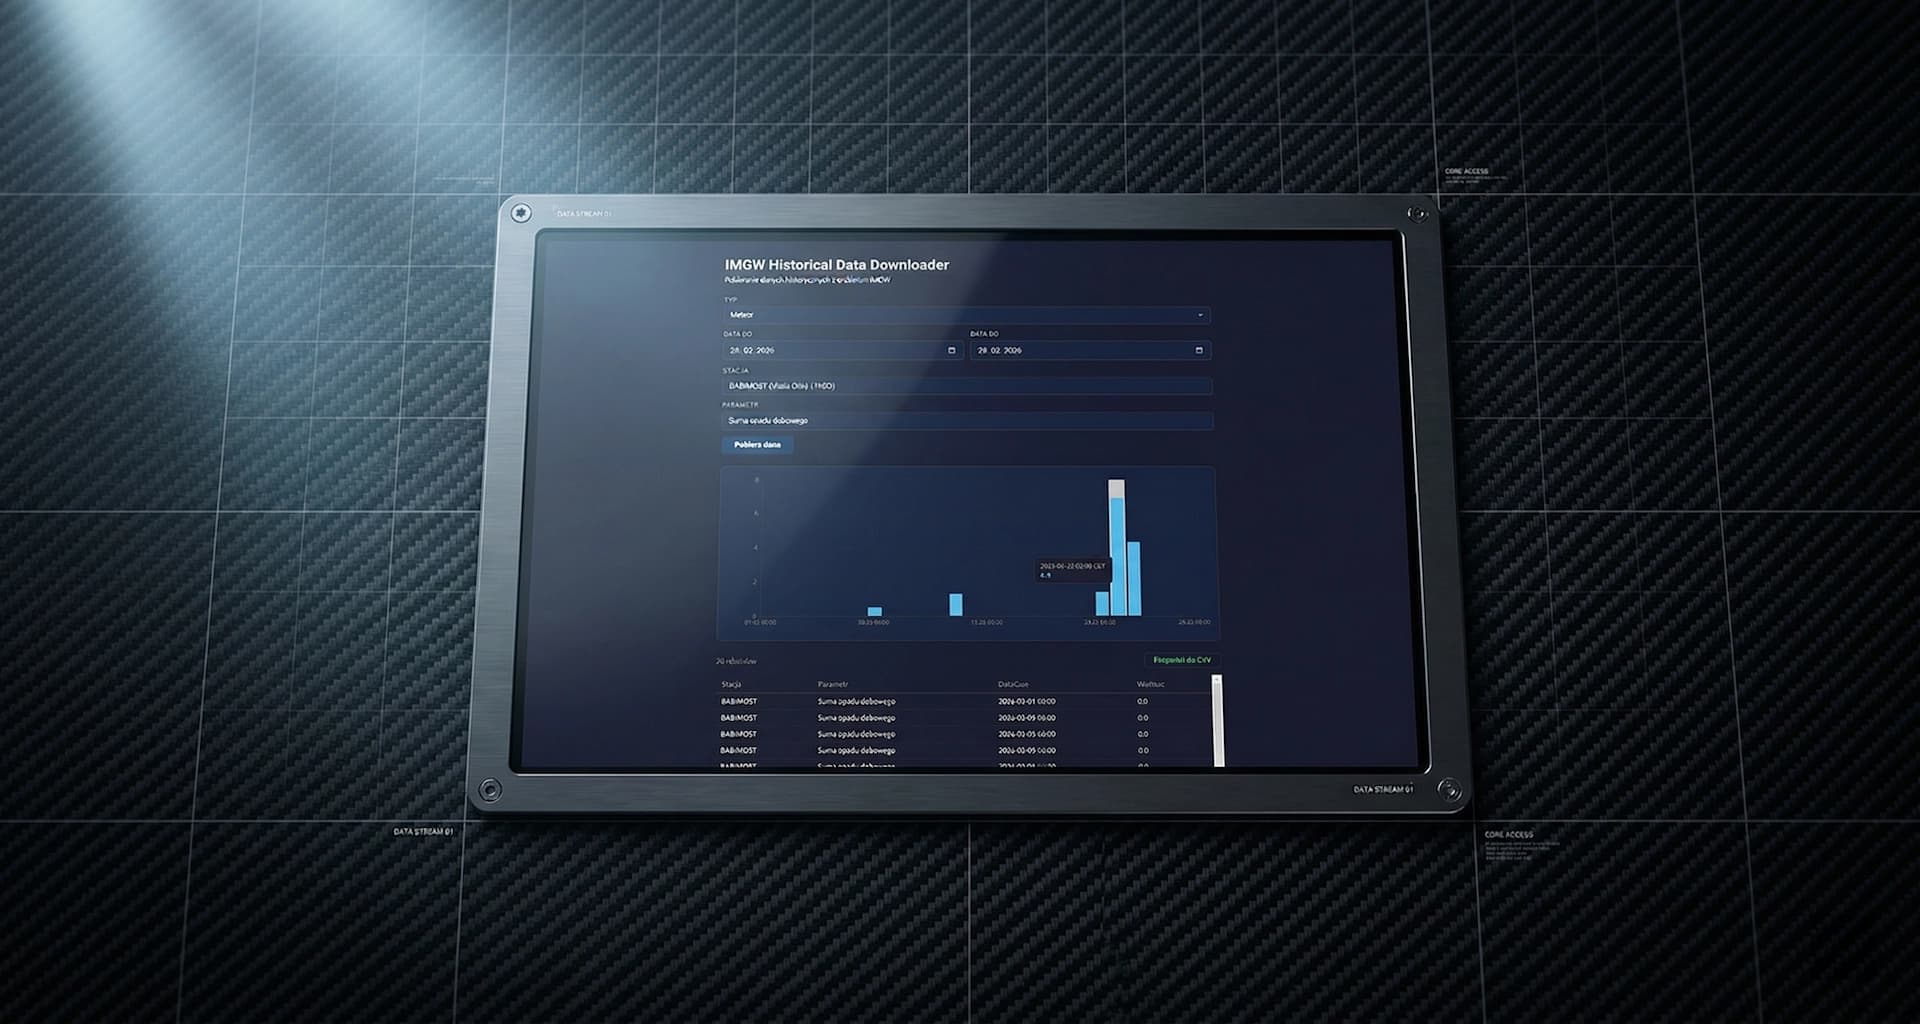
We integrated a native charting module directly into the single-screen interface. Once data is fetched, the app instantly plots the parameter's trajectory (e.g., annual rainfall or water levels), allowing the operator to validate trends visually before generating the final export.
Multi-Source Adapter (eDWIN)
We added a source switcher that reloads the station list on toggle and normalizes eDWIN's multi-parameter agricultural payloads into the same shape our table and chart components already expect - extending the tool to ~534 agrometeorological stations without touching the existing IMGW pipeline.
Technology Used.
Wodowskaz
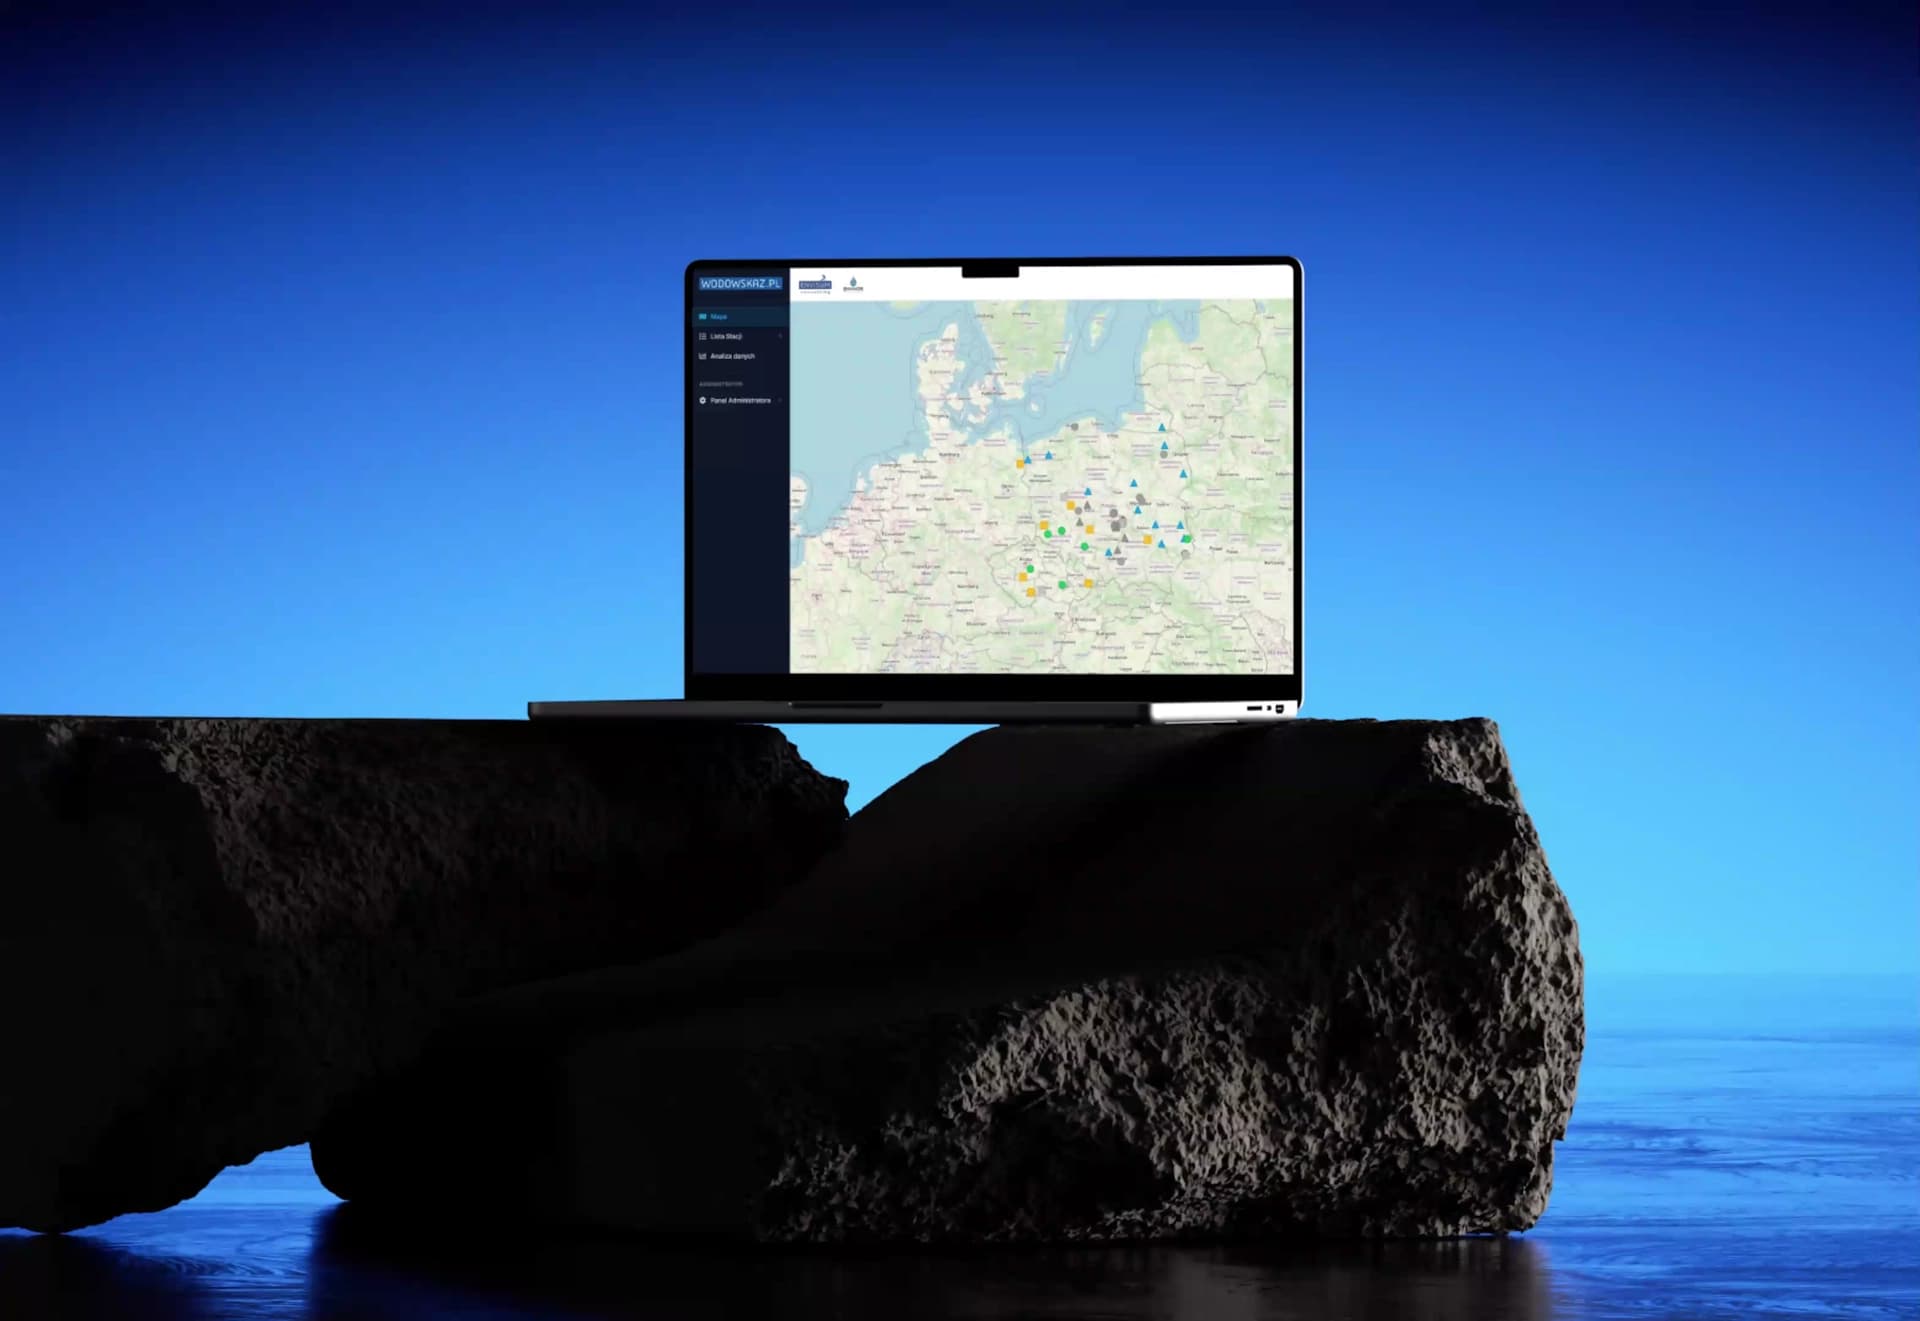
Centralizing fragmented telemetry into one real-time system - with field verification that catches drifting sensors before they mislead you.

Ironman Athletic Club
High-throughput digital architecture engineered for peak performance, traffic scalability, and seamless user conversion.